Forecasting accuracy is generally enhanced with the addition of more datapoints. Unfortunately, nobody can create more financial data without a time machine handy. Unlike a clinical trial where you can sample another 1,000 people, you simply must wait for each interval (be it a tick, day, month, etc.) to pass.
Given a finite length time series, practitioners generally use an end-of-day frequency to calculate statistics such as volatility. A prediction model, no matter how rudimentary or advanced, is necessary to forecast the next day’s value. Given 252 trading days of data, the model will digest a certain amount of information, leading to a prediction value for the 253rd day. The prediction could be the result of simply taking the value from the 252nd day, or, in the case of a more advanced forecast method such as the Heterogenous Autoregressive Realized Volatility (HAR-RV) model [1], an OLS regression.
While the inputs to the HAR-RV OLS model are values at the close of each trading day, they are constructed using equally spaced intervals throughout the trading day. In other words, this process requires a 15-minute frequency [2] and then aggregates each day’s information to a daily frequency before feeding it to the regression model. While this framework has been standard for over a decade, we improve it by more efficiently using the available data.
About a year ago, we introduced a paper outlining an approach we called “Rolling Realized Volatility”. [3] This approach provides the OLS model more informational content to make a more accurate prediction. For example, assume we have 3 available days, each sampled at a 15-minute time interval, resulting in 78 total observations (3 days * 26 15-minute intervals per day). The traditional “calendar” method feeds 2 observations to the OLS regression. [4] Conversely, our rolling approach increases this number to 27. It does this by aggregating data on every 15-minute timestamp instead of only on every 16:00 timestamp.
Exhibit 1: Calendar vs. Rolling Estimation Setup
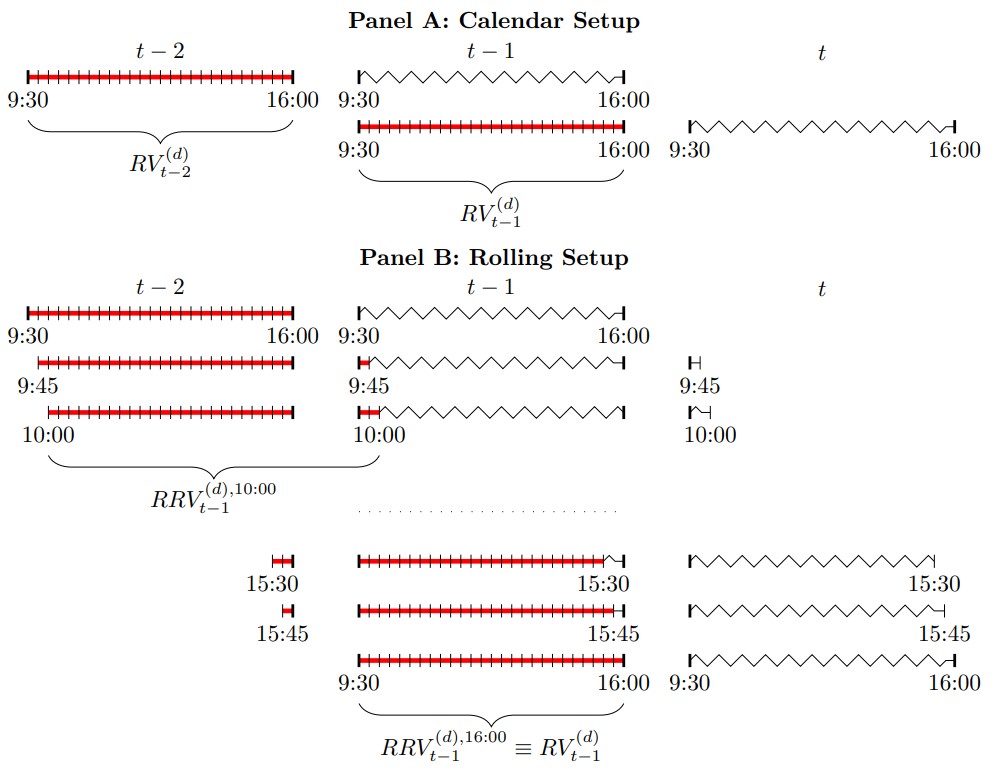
Source: Salt Financial.
Exhibit 1 illustrates the setup for predicting day t+1 with knowledge of the trailing 3 available days (t-2, t-1, and t). The red lines indicate independent variables in the regression, while the subsequent wavy line represents the corresponding dependent variable. Notice how this dataset only generates 2 observations with the traditional calendar method (Panel A). The rolling method, shown in Panel B, creates additional trailing “days” by spanning observations across the two calendar days.
This improves forecast accuracy by taking the two observations from Panel A, adding an additional 25 observations, for a total of 27, and then doing the OLS regression. For example, when examining the S&P 500, the rolling method’s forecast loss is only 97.35% of that from the calendar approach. Additionally, for the average Dow Jones Industrial component, the rolling method’s loss is only 98.72% of the calendar approach. A number less than 100% indicates preference for the rolling methodology. [5]
The required data, aggregation method, and statistical knowledge are all the same between the two methods. The difference is the latter increases the information dynamics of the prediction by adding more data to the estimation process. Ultimately, we can adapt and integrate this approach for index-linked strategies focused on volatility targeting, aiming to harvest returns more efficiently from the volatility scaling process.
For more detail regarding the econometrics theory, methodology, and results, please see the full paper available here.
[1] Corsi, F. (2009). A Simple Approximate Long-Memory Model of Realized Volatility. Journal of Financial Econometrics 7 (2), 174–196.
[2] Various intervals are possible. While 5-minute intervals may be industry standard, there is also academic backing for lower frequencies such as 15- to 30-minutes, which reduces the influence of market microstructure noise.
[3] Pascalau, R. & Poirier, R. (2020). Increasing the Information Dynamics of Realized Volatility Forecasts. Available at SSRN: https://ssrn.com/abstract=3632984.
[4] While there are 78 observations, the model will only “know” of 3 distinct datapoints, each consisting of a unique set of 26 15-minute returns. However, for out-of-sample forecasting, you lose 1 observation in the estimation process, resulting in only 2 observations going into the OLS regression.
[5] See [3], Table 3, for the full table of relative forecast losses.