Differences Between Low Beta and Low Volatility for Defensive Portfolios
Tony Barchetto, CFA | Chief Executive Officer | tony@saltfinancial.com
- Beta and volatility are similar measures of risk with some key differences.
- Ranking by beta vs. volatility tends to produce different tilts in sector weighting.
- Low beta portfolios can potentially offer better protection in down markets and lower sensitivity to interest rate shocks than low volatility portfolios.
Funds targeting lower risk equity strategies have been very popular with investors lately, with nearly $14 billion flowing into low volatility ETFs since September 2018 [1]. But not all low volatility ETFs are created alike. Most low volatility strategies construct portfolios based on historical volatility, but others use low beta as their primary criterion. Both tend to be more defensive strategies, looking to win by “losing less” in market downturns. But there are some fundamental differences.
Although both are measures of risk, sorting a portfolio by low beta tends to generate a different mix of sectors in comparison to one sorted by low volatility. The calculation of beta considers the correlation of the asset to the market as well as its relative volatility. As a result, some stocks with very low correlation to the market but slightly higher volatility have a higher probability of being included in a low beta portfolio.
A low beta portfolio of large cap stocks will tend to allocate more weight to Consumer Staples and Health Care stocks and less weight to Financials and Utilities in comparison to a low volatility strategy. Using the top 1000 US stocks by market capitalization, we formed equally-weighted portfolios monthly from the bottom 20% by both beta and volatility from March 1996 through March 2019 [2]. The table below shows the average allocation to each sector for the entire time period for each strategy.
Table 1 – Mean Sector Weights for Bottom 20% by Beta and Volatility
March 1996 – March 2019
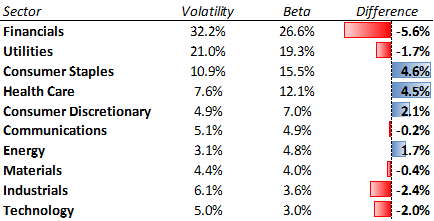
Source: Bloomberg, Salt Financial calculations
Both strategies have the same top four sectors and in the same order. But the low beta strategy has about a third more exposure in Consumer Staples and Health Care. Why does this matter? While the four top sectors for both tend to outperform when the market is rocky, some are more resilient than others.
We used S&P sector indices from Bloomberg to calculate the return of each relative to the market (S&P 500) every quarter from September 1989 through December 2018 [3]. Then we computed an average return for each sector for all periods, up periods only, and down periods only.
Table 2 – Average Quarterly Sector Returns Relative to the S&P 500
Up vs. Down Markets, September 1989 – December 2018
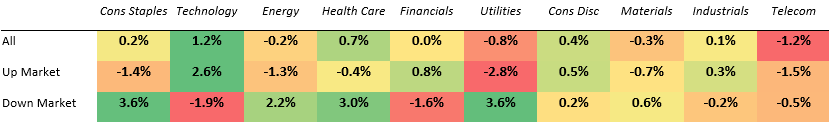
Source: Bloomberg, Salt Financial calculations
While Consumer Staples and Health Care lagged in up markets, they outperformed in down markets, ranking only behind Utilities as the most defensive sectors. However, the relative performance of Utilities was by far the worst when markets were rising.
In addition to broader equity market returns, interest rates are huge drivers of relative sector performance. The table below uses the same sector indices to show relative performance of each sector in rising rate environments versus declining ones. To measure the rate environment, we simply used the change in yield in 10-year Treasuries over the quarter.
Table 3 – Average Quarterly Sector Returns Relative to the S&P 500
Rising Rates vs. Declining Rates, September 1989 – December 2018
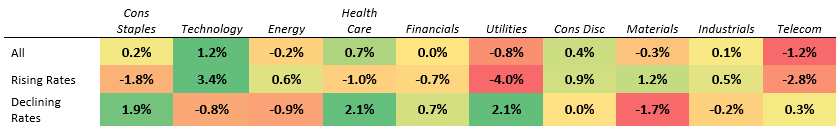
Source: Bloomberg, Salt Financial calculations
One of the criticisms of low volatility strategies is their increased sensitivity to interest rate shocks. The traditional lower volatility sectors often pay higher dividends, acting as “bond proxies” for more conservative investors. As rates rise, investors gravitate from these bond proxies to fixed income, as the coupon from bonds becomes more attractive with the added protection of principal. Why assume the risk of equities if you can generate the income from interest on the bonds?
The relative performance of the bond proxy sectors above confirms this effect. Utilities, which tend to pay among the highest dividends, performed by far the worst in rising rates scenarios, with Consumer Staples and Health Care also suffering but not nearly as much (1-2% on average for the quarter vs. 4% for Utilities) [4]. However, low beta also tends to allocate more weight to the Consumer Discretionary and Energy sectors in addition to lower weight in Utilities (see Table 1 above), providing some additional ballast in the portfolio when rates rise.
No strategy will be perfectly optimal to capture gains on the upside and protect against losses on the downside. There are always trade-offs and of course the past performance is no guarantee of future results. But based on historical analysis of strategies targeting lower risk, the sector mix of a low beta portfolio can potentially help balance both offense and defense better than one focused on volatility alone.
[1] Source: Bloomberg
[2] The top 1000 are sourced from the Solactive US Large and Midcap Index, which is based on the largest US stocks ranked by free-float market capitalization. Sector classifications are sourced from Bloomberg’s BICS.
[3] The sector classifications in these indices are derived from the Global Industry Classification Standard (GICS), jointly owned by MSCI and S&P. Although GICS recently reorganized its sectors, enhancing the Telecom sector as Communications with the addition of some Internet and media stocks from other sectors, these indices reflect the original sectors prior to the change.
[4] Telecom, a small sector consisting largely of utility-like phone companies that also tend to pay higher dividends, also performed poorly during rising rates. However, since GICS eliminated Telecom and replaced it with the enhanced Communications sector with much different characteristics, we did not address its past performance in comparison.
 Prev
Prev

Adaptive Indexing Starts with the Right Partner
Don't miss the next release
Be the first to know when Salt publishes its latest analytics, research, and insights
Disclaimers
The information provided herein is for information purposes only and is not intended to be and does not constitute financial, investment, tax or legal advice. All investments are subject to risks, including the risk of loss of principal. Past performance is not an indicator of future results.
The information and opinions contained in Salt’s blog posts, market commentaries and other writings are of a general nature and are provided solely for the use of Salt. This content is not to be reproduced, copied or made available to others without the expressed written consent of Salt. These materials reflect the opinion of Salt on the date of production and are subject to change at any time without notice. Due to various factors, including changing market conditions or tax laws, the content may no longer be reflective of current opinions or positions.
The information contained herein is not intended as a recommendation to buy, hold or sell any security. The investment performance described herein is simulated and does not reflect actual performance data. Actual investment performance may vary. There is no guarantee that an investment will be profitable and all investments bear the risk of partial or complete loss of capital. Past performance is not an indicator of future results.
Any market observations and data provided are for informational purposes only. Where data is presented that is prepared by third parties, such information will be cited, and these sources have been deemed to be reliable. However, Salt does not warrant the accuracy of this information. Salt and any third parties listed, cited or otherwise identified herein are separate and unaffiliated and are not responsible for each other’s policies, products or services.
Salt Financial LLC
44 Amogerone Crossway, #7910
Greenwich, CT 06830- 475-450-0500
- Contact Us