In early December 2018, we highlighted the rebalancing of iShares’ MTUM (tracks the MSCI USA Momentum Index), which normally occurs twice per year (May and November). As we detail in the post, the reshuffling of the components of this index on the last day of November led to a significant change in both the sector mix and sensitivity to market moves.
The market risk in the portfolio—as measured by a weighted average of our truBeta™ estimates for each component—dropped considerably from 1.19 on November 30th to 1.01 after the rebalance based on the new components and weights.[1] This indicated a shift from higher beta, more volatile stocks to a portfolio with a risk profile that looks somewhat like the S&P 500.
In a rising market, momentum strategies are buying winners and selling losers, potentially leading to large drawdowns from time to time. To mitigate this risk, some momentum-based strategies use other signals from spikes in recent volatility to “conditionally rebalance” the portfolio. This condition was triggered on January 31, 2019 for the MSCI USA Momentum Factor Index that MTUM tracks.
According to the methodology from MSCI, the index will rebalance again if the annualized 3-month volatility of the market as computed 9 days before the end of the month exceeds the 95th percentile of monthly changes in the broader index used to select the stocks.[2] With the rise in volatility in Q4 2018, this signal triggered in January and the index was rebalanced at the close of trading on January 31, 2019.[3] According to the rules in the methodology, in this scenario the components are selected using only the 6-month returns instead of a blend of the 6- and 12-month returns in the standard index selection process.[4]
As a result, the new-look MTUM after the recent ad-hoc rebalancing radically shifted its sector mix and risk profile again, just two months after the last regular rebalance.
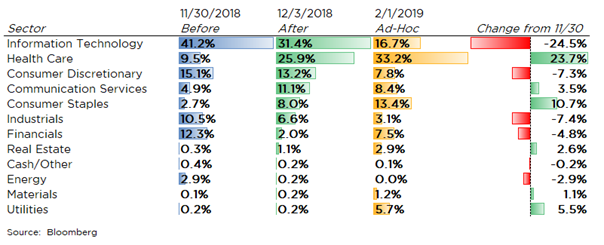
The allocation to Information Technology was chopped in half from the last rebalance (and down 60% from the November portfolio) to currently just 16.7% of the fund. Health Care is now dominant, making up a full third of the fund’s exposure. Consumer Staples, traditionally viewed as more defensive, increased to the third largest sector at 13.4% (up from 2.7% in the November portfolio).
The top 5 holdings in the fund in late November were Microsoft, Amazon, Visa, Boeing, and Mastercard. Following the latest ad-hoc rebalance on the last day of January, the top 5 are Procter & Gamble, Pfizer, Merck, Johnson & Johnson, and Microsoft.[5]
The weighted average truBeta™ for MTUM on January 30th (old basket) was 0.98, very close to the 1.01 estimate back on December 3rd.[6] But the current truBeta™ estimate for the fund with the new sector allocations following the ad-hoc rebalance on February 1st (new basket) averaged just 0.77. For comparison and context, iShares’ USMV, which tracks the MSCI USA Minimum Volatility Index, tallied an average truBeta™ of 0.71 on the same day.[7]
As we stated in in our previous post, this does not mean momentum as a strategy does not “work”, as it is designed to capture a premium over time for longer term investors. But based on its current truBeta™ estimate of 0.77, investors can expect the current portfolio in MTUM to underperform in a rising market and outperform in a declining one. The recent shift to a more defensive posturing may turn out to be successful if the market begins to rotate from growth and higher beta stocks back to more value-oriented and lower volatility names before its next rebalance in May 2019.
The only potential cause for concern is properly setting the expectations of the investor on how the fund is likely to behave in the shorter term. For some investors, the shift to lower beta stocks and sectors in MTUM may be a welcome change. But others using MTUM tactically in expectation it will rise more than the S&P 500 in a rising market are likely to be disappointed if the market continues its run.
We only discovered this change in risk profile for MTUM from our daily calculations of truBeta™ on all US stocks and over 1,000 equity ETFs every day. Currently, we are expanding our capabilities using underlying components as well as pricing data from the ETFs themselves to generate truBeta™ risk metrics on all equity ETFs listed in the US. We look forward to making our data and analytics available to investors and advisors sometime in the first half of this year.
[1] Source: Bloomberg, Salt Financial calculations
[2] Page 13 of the methodology, available at: https://www.msci.com/eqb/methodology/meth_docs/MSCI_Momentum_Indexes_Methodology_June2017.pdf
[3] Source: Comparison of portfolio holdings from Bloomberg, iShares on 1/30/2018 vs. holdings on 2/1/2019
[4] For more details on the conditional rebalancing and other index rules, please see the index methodology document referenced above.
[5] Source: Bloomberg
[6] Source: Bloomberg, Salt Financial calculations
[7] Ibid.
 Prev
Prev

Adaptive Indexing Starts with the Right Partner
Don't miss the next release
Be the first to know when Salt publishes its latest analytics, research, and insights
Disclaimers
The information provided herein is for information purposes only and is not intended to be and does not constitute financial, investment, tax or legal advice. All investments are subject to risks, including the risk of loss of principal. Past performance is not an indicator of future results.
The information and opinions contained in Salt’s blog posts, market commentaries and other writings are of a general nature and are provided solely for the use of Salt. This content is not to be reproduced, copied or made available to others without the expressed written consent of Salt. These materials reflect the opinion of Salt on the date of production and are subject to change at any time without notice. Due to various factors, including changing market conditions or tax laws, the content may no longer be reflective of current opinions or positions.
The information contained herein is not intended as a recommendation to buy, hold or sell any security. The investment performance described herein is simulated and does not reflect actual performance data. Actual investment performance may vary. There is no guarantee that an investment will be profitable and all investments bear the risk of partial or complete loss of capital. Past performance is not an indicator of future results.
Any market observations and data provided are for informational purposes only. Where data is presented that is prepared by third parties, such information will be cited, and these sources have been deemed to be reliable. However, Salt does not warrant the accuracy of this information. Salt and any third parties listed, cited or otherwise identified herein are separate and unaffiliated and are not responsible for each other’s policies, products or services.
Salt Financial LLC
44 Amogerone Crossway, #7910
Greenwich, CT 06830- 475-450-0500
- Contact Us