Liquidity is abundant when you don't need it and scarce when you do. This may seem obvious but has been true from the Buttonwood Tree to the Crash of 1987 to the Global Financial Crisis to today. Markets have evolved to be more efficient and electronic, but no amount of automation or regulation can stave off the chaos of a violent selloff, like the one we are experiencing following the global outbreak of COVID-19.
Liquidity right now is abysmal by almost any measure. In early March, market depth in the widely traded S&P 500 E-Mini futures contracts collapsed by over 90% from 2019 levels. Even the SPY—the most actively traded equity in the world—isn’t immune. Normally a penny wide all day, the bid/ask spread in SPY blew out to 5 cents near the close on March 13th, which is gaping wide by its standards.
Looking at spreads across the broader US equity market, the data suggest that liquidity now is worse than it was following the collapse of Lehman Brothers in September 2008.
We looked at average bid/ask spreads for the top 500 instruments ranked by 30-day value traded on US stock exchanges (equities and ETFs) every day from March 2004 through March 31, 2020. We calculated the daily averages from 15-minute snapshots of the bid/ask and then weighted those values by their 30-day ADTV to put more emphasis on the demand for liquidity instead of just the quote.[1]
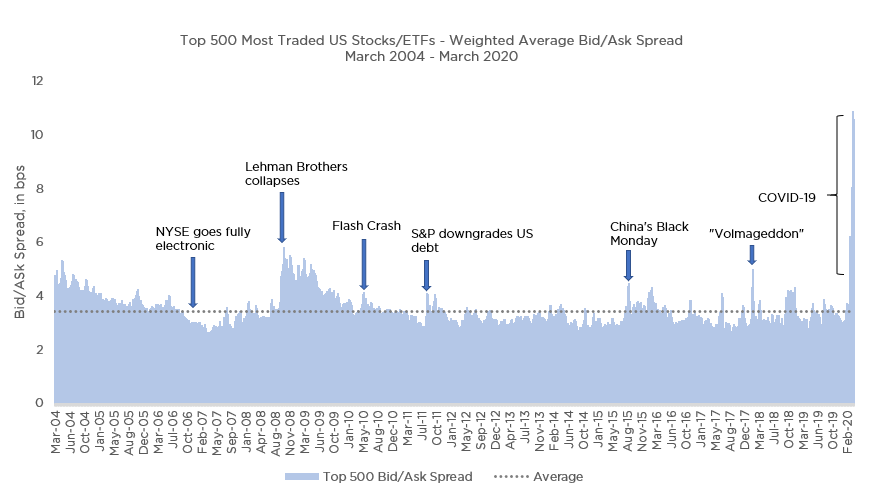
Source: Livevol, Salt Financial calculations.
The average spread (dotted line) over the entire period was 3.41 bps. Prior to March, the previous high was 5.79 bps on October 10, 2008, a day that marked the intraday low for the month and followed 7 straight days of selling. From the all-time highs on February 19th, 2020 when spreads were at the long-term average, it spiked to 10.86 on March 20th before receding to 7.23 on March 31st—a level still 25% higher than the peak following Lehman in 2008.[2]
Here’s a look at the daily values from February through March against closing values for the VIX to better show how liquidity conditions worsened as volatility picked up.[3]
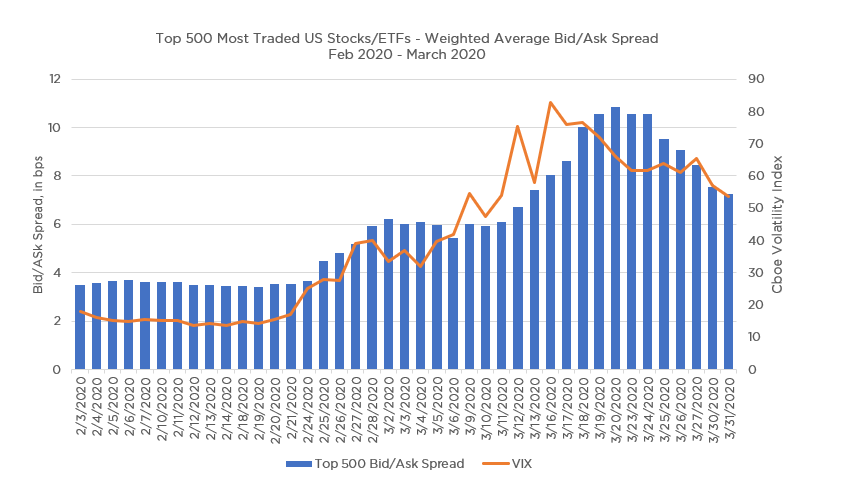
Source: Livevol, Bloomberg, Salt Financial calculations.
Ask any trader in almost any market on the planet and they will tell you the market “feels” thinner than it’s ever been. But this time the numbers solidly back up the anecdotal evidence. It really is that bad out there. Grab your helmets—we’re in for a rough ride.
[1] The data were cleansed to eliminate any obvious outliers and holiday weeks (July 4th Thanksgiving, Christmas to New Year’s) were dropped to provide better comparisons across “normal” markets.
[2] To rule out any data quality issues explaining the extreme values, we spot-checked March 2020 figures against a separate high-quality market data source (Bloomberg) using identical filters. There were no material differences in the calculated weighted average spreads.
[3] The spikes in bid/ask spreads obviously correlate with levels of market volatility. We omitted the VIX from the longer-term chart to reduce some of the clutter.