Low volatility equity strategies have been popular in recent years, helped by some bursts of volatility that dared defy the bull market that emerged from the wreckage of the Global Financial Crisis. First introduced in 2011, assets in low volatility ETFs by the end of 2019 swelled to over $87 billion, up from $11 billion in 2014 [1]. But the benefits of low volatility investing have been known for far longer, with early research from the 1970s using data going to back to the 1920s [2].
While the academic research is compelling, low volatility investing is also relatively simple to understand and has some comforting psychological benefits. The idea is to win more over the long term by “losing less” in the downturns. This is usually illustrated with some basic math—a 30% drop in the market requires a 42.9% rally just to get back to even. And who doesn’t love the idea of losing less and having fewer violent swings in their portfolios?
However, protecting against market crashes are not what these strategies are designed to do. A low volatility equity strategy is still 100% invested with risk potentially mitigated, but not eliminated. A look at the two most popular low volatility ETFs in the US, the iShares Edge MSCI Minimum Volatility USA ETF (USMV) and the Invesco S&P 500 Low Volatility ETF (SPLV), during the rout ignited by the outbreak COVID-19 in late February through March 2020 illustrates this point.
From the all-time high on February 19th of this year to the trough on March 23rd, the S&P 500 (Total Return) fell 33.8%. Over that same period, the indices tracked by USMV and SPLV dropped 35.7% and 33.1% respectively [3]. In the rally that followed, the S&P 500 climbed back to down only 7.8% through June 30th from that February 19th peak compared to -11.8% for USMV and -18.3% for SPLV [4]. What happened to losing less? Did these strategies fail their biggest test since they arrived on the scene in 2011?
The Long Term View
Academic research shows low volatility generating strong risk-adjusted returns going back decades. Isn’t that enough proof the strategies are battle-tested, despite the recent blip? Instead of academic research, which can include some unrealistic assumptions that make implementation less practical, we use total return indices from well-known providers to show how low volatility strategies have fared relative to the broader market.[5]
We analyze the period from December 1978 through the present, balancing a long run of historical while still focusing on the “modern” era of institutional investing [6]. To identify periods of market dislocation, we turn to Yardeni Research’s helpful S&P 500 Bull & Bear Market Tables, which shows peak to trough corrections and bear markets in the S&P 500 going back to 1928.[7] As a proxy for investable low volatility investing, we focus on the S&P 500 Low Volatility Index (“SPX Low Vol”), which was launched in April 2011 but has back-tested data going back to the 1970s. [8] While we use the S&P 500 cash index drawdown data from Yardeni, we use the Russell 1000 Total Return Index as the market proxy, since the S&P 500 Total Return series only goes back to 1988.
Table 1 – Russell 1000 vs. S&P Low Volatility Drawdowns, 1978-2020
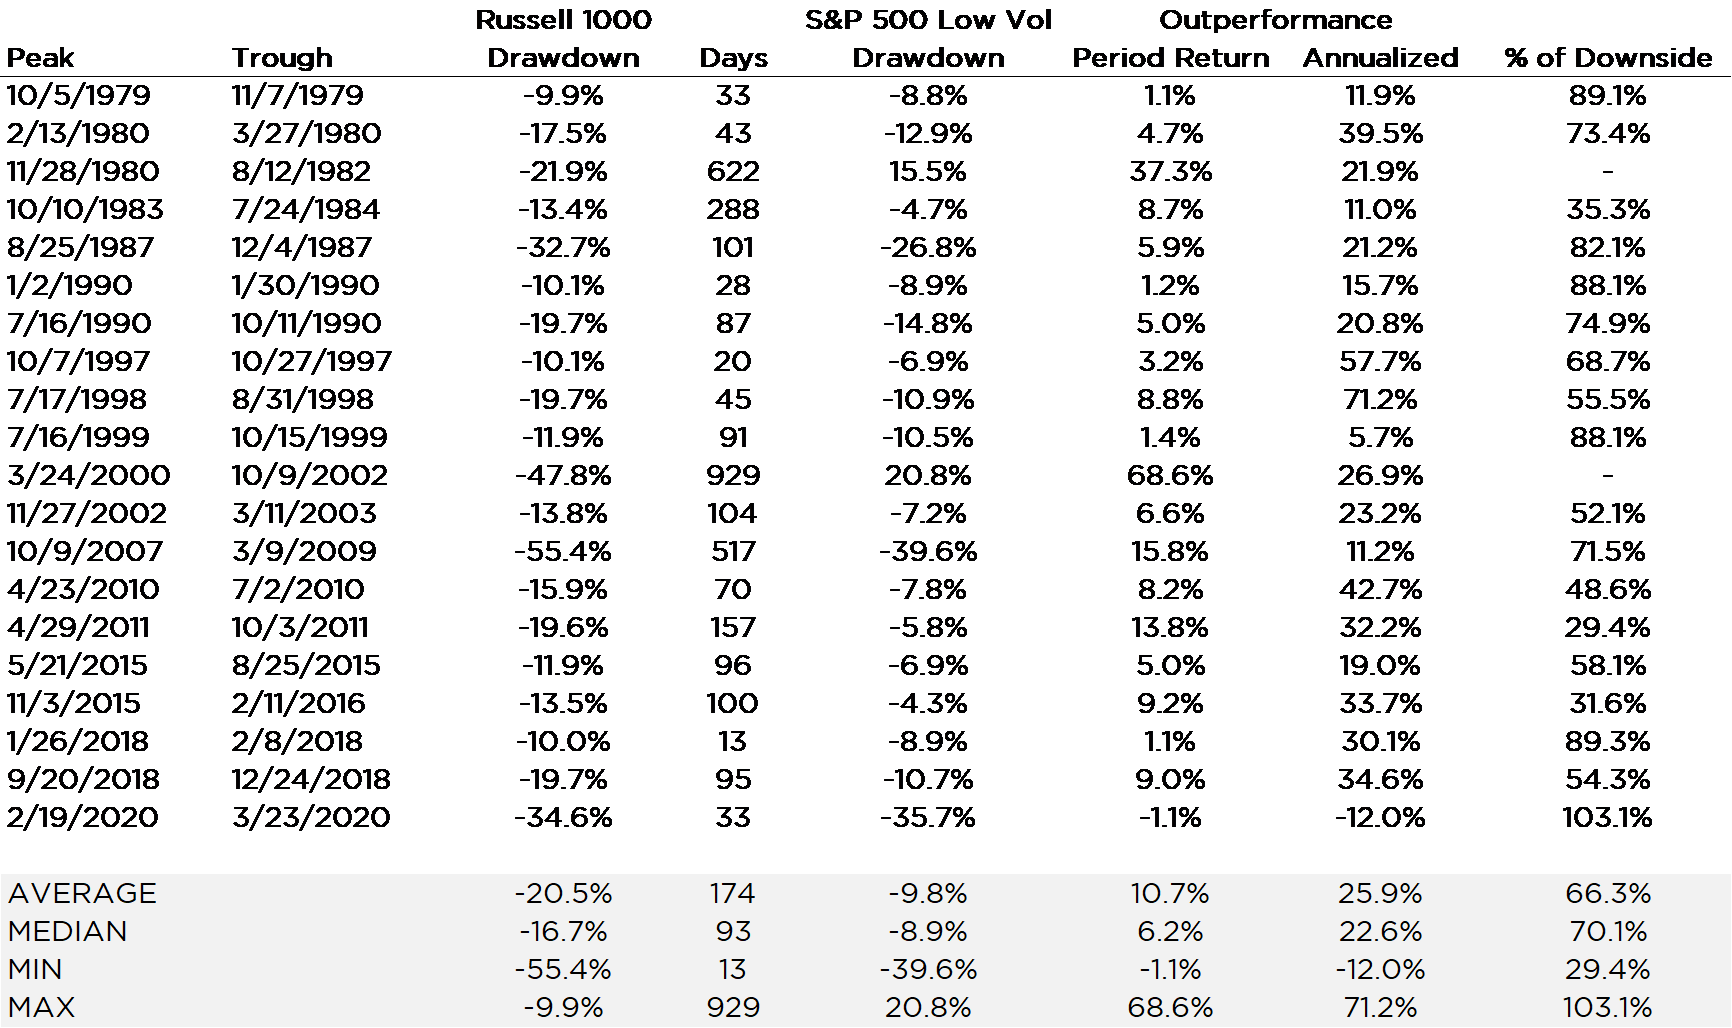
There have been twenty distinct drawdowns of 10% or more since December 1978 averaging down 20.5% in magnitude and 174 days from peak to trough. [9] But they vary in length, severity, and outperformance between the market and low volatility proxy.
We express outperformance in both period (peak to trough dates) and annualized terms for more context. Shorter, more shallow drawdowns will look relatively tame compared to longer grinds lower, so offering the two views allows for more uniform comparisons.
We also view the SPX Low Vol in terms of “participation” in the downside by simply dividing it by the Russell return over the period. On average, SPX Low Vol managed to avoid about a third of the loss experienced by the market.
On two occasions, SPX Low Vol experienced no downside and increased in value while the market sold off. It took 929 days for the market to find a bottom in 2002 after the dot-com bubble popped in March 2000. During this time, lower volatility stocks, which contained a lot of more value-oriented names that sat out the distended 1999-early 2000 rally in technology shares, notched a 20.8% increase while the market tanked 47.8%. The other was the 622 days it took for the market to find the generational bottom for equities and top in Treasury yields in 1982 after the Federal Reserve broke the back of inflation with interest rate hikes.
The overall scorecard for low volatility looks pretty good. A median decline of just 8.9% compared to the 16.7% market decline is a meaningful reduction. But one data point stands out—the recent COVID-19 period was the only one of the twenty in which low volatility failed to outperform the market.
So does that mean it’s “broken”? In short, no.
It’s Not an Airbag
The COVID-19 crash we saw in March was unusual in several ways. The abrupt, forced halt of economic activity was caused by a health care crisis and not by an overheating or slowdown of the economy. “Defensive” sectors that are usually more resilient in economic downturns, such as utilities and real estate, performed poorly. Many low volatility strategies (including SPX Low Vol) were overweight these sectors coming into the COVID outbreak, owing to their historically lower risk. Other more defensive sectors such as health care and consumer staples held up much better, but not by enough to fend off the decline. Low volatility funds also tend not to hold many technology stocks, which have fared relatively well, especially in the recovery from the March low.
The March sell-off also proved to be the fastest 20%+ decline in history, taking only 33 days—half the time it took during the 1929 crash to find a short-term bottom. In early 2018, we also witnessed the fastest 10% correction in history, taking only 13 days for the “Volmageddon” episode to unfold and hit bottom.
The low number of data points used in studying past drops and crashes makes drawing meaningful conclusions exceedingly difficult. But there seems to be a relationship between the brevity of the correction and the ability for low volatility strategies to outperform. For periods less than 90 days in length, the average participation on the downside was 77%. For those longer than 90 days, the participation was just 56%--and this does not include the two scenarios described above in which low volatility ended up higher in value.
The market is a discounting machine that is always looking at the future. The wisdom of crowds may be better than the judgment of a single individual but is not infallible. Of the 20 periods identified above, only 7 of them successfully predicted a recession, as evidenced by its occurrence either during the drawdown period or within one year of its trough.[10] The rest are mostly just noise—emotional reactions, technical selling, market structure blips, misinterpretations of the fundamental impact of a particular piece of news. If it were easy, we would all be rich.
Low volatility strategies can be an effective component of a diversified portfolio. But they need to be used properly and with the right expectations.[11] The data show their value is most beneficial when the bear growls the longest. As fears turn into recession and eventual declines in earnings, low volatility stocks tend to outshine their sexier cyclical growth counterparts. But using them to hedge against volatility in the short-term has a mixed record at best.
So far, we have not seen low volatility outperform as the market shrugs off the outbreak. The broader market recovered and technology shares are making new highs, which is not what most people would have predicted on St. Patrick’s Day 2020. But the end of that story is yet to be written.
[1] Bloomberg, 12/31/2019
[2] Known in the academic literature as the “low volatility anomaly”, there are numerous studies analyzing the phenomenon from multiple angles. For those who cannot figure out how to Google any of that, here is a 5 minute explainer video from asset manager Robeco
[3] MSCI USA Minimum Volatility Gross Total Return (M00IMV$T) and the S&P 500 Low Volatility Total Return Index (SP5LVIT), both from Bloomberg.
[4] Bloomberg, period from 2/19/2020 through 6/30/2020
[5] While some academic studies do account for real world friction such as transaction costs and taxes, many are based on monthly rebalancing of hypothetical portfolios that may not be the best representation of an investable strategy.
[6] Looking at patterns over decades of data back to the 1920s can be a good thing, as it may reveal more information from multiple shocks and market cycles. But it also covers decades of change in the way markets are structured and operate. The participants, regulation, costs, business practices, technology, and information flow changed dramatically from the 1920s through the present. For example, institutional investors held less than 20% of listed US stocks in the early 1970s with individual households owning most of the rest. Today that proportion has flipped with institutions increasing participation and individuals using mutual funds and ETFs for investing (See The Rise of Institutional Investors for additional detail on the history).
December 1978 also happens to be as far back as we can get reliable total return index data.
[7] We were too busy lazy and didn’t feel like coding the logic to calculate the drawdowns from the index data. Why reinvent the wheel?
[8] Back-tested performance applies the same methodology to historical data but is hypothetical, has the benefit of hindsight, and is not representative of actual performance. You cannot invest in the index.
[9] Yes, the first one on the table is 9.9%. There will be relatively small performance differences between the Russell 1000 and S&P 500 as large cap proxies as well as the use of total returns versus price return declines as the drawdown measure.
[10] There have been 6 recessions since March 1975. Some of the distinct drawdown periods are close enough in time to be associated with a single recession.
[11] There are many variants of low risk strategies—low volatility, low beta, minimum variance. But they all perform similarly over the long term. The biggest low vol ETF is the $34 billion USMV, which uses an optimizer to select the combination of stocks targeting the lowest variance, using correlations as well as volatility to help lower risk. But the MSCI index it tracks only has daily data back to May 1994, limiting its usefulness for our purposes. But for comparison, SPX Low Vol managed lower participation on the downside—62.5% vs. 71.1%--over that common period. And aside from COVID-19, there was not a single period in which the MSCI version outperformed SPX Low Vol on the downside, plus it declined during that 2000-2002 period with the market. This does not make it a bad strategy—it has solid long term returns and consistently lower risk than the market.