Salt ETFs Perspective: Don’t Judge an ETF by the ADV
Tony Barchetto, CFA | Chief Executive Officer | tony@saltfinancial.com
In one of our earlier posts, we outlined some simple trading tips for investors and advisers trading US equity-based ETFs. As a rule, the more liquid the underlying holdings, the easier it is to transact in size in an ETF. For smaller trades (generally under 10,000 shares), investors and advisers who use limit orders, wait a few minutes after the opening of trading for spreads to tighten, and pay attention to the INAV (estimated current value of the underlying securities in the fund) for US-listed equity ETFs can generally expect a good execution if the stocks in the fund are liquid.
But what about larger trades over 10,000 shares? Again, it’s the liquidity of the underlying holdings in the fund that is important. The size of the fund itself (AUM) and the average daily volume (ADV) do not indicate the capacity or liquidity available in the fund. The volume in many lower volume ETFs is only a tiny fraction of the available liquidity—there is often far more below the surface.
Implied Liquidity
Most investors and advisers have access to basic trading information such as last sale, bid and offer, and ADV, which unfortunately tells you nothing about the liquidity “implied” in the underlying holdings. So where can you find out more information?
Bloomberg’s ETF Implied Liquidity (“ETFL”) is one very helpful tool if you have access to a terminal. This metric scales the underlying basket to its least liquid holding, assuming you could trade 25% of that stock’s individual ADV without adversely affecting the price (the percentage is configurable). It reduces everything to a single number—the number of shares in the ETF that could be potentially traded by accessing the underlying basket (they also include a dollar value as well). [1]
The fund pages on ETF.com are another resource—which also happen to be free. Simply type in the ETF ticker in the search bar up top, click on the “Fund Report” link, and a wealth of information on the fund will appear. Scroll about halfway down the page and on the right-hand side atop some basic information on volume and spreads is a “FactSet Analytics Block Liquidity” scale. Ranked from 1-5 (5 being the most liquid), it provides an estimate of how easy it would be to trade a $1 million block in the ETF. While it lacks the specifics of the Bloomberg tool, we believe it’s a good starting point in understanding the implied liquidity of the underlying basket.
Anatomy of an ETF Trade
As a smaller issuer with a recently launched fund, we field questions on the liquidity of our ETF all the time. As of November 16th, the 30-day ADV in the Salt High truBeta™ US Market ETF (Ticker: SLT) was 11,090 shares. But the implied liquidity—according to Bloomberg’s metric—is currently 54.1 million shares or $1.25 billion per day [2].
On November 15th, an investor executed a block trade in SLT of 62,760 shares at $23.18 (about $1.5 million in value) at 3:37PM, right in-line at the quoted offer. It was not a particularly active day for the ETF, with only 1,818 shares traded before the block. [3] But the liquidity of the underlying basket was sufficient for a market maker to execute the order in full, without moving the price, as they could hedge their exposure quickly and efficiently.
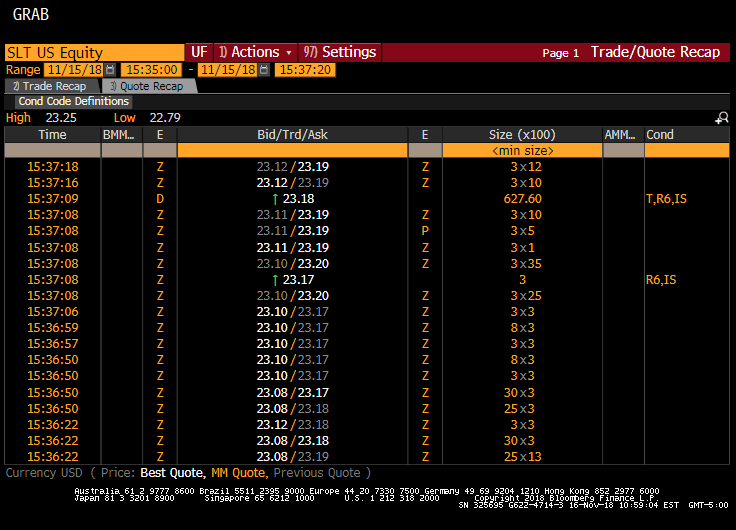
Source: Bloomberg
This happens day in and day out in many lower volume ETFs with liquid underlying holdings. Our trade was certainly not the biggest—a number of issuers can highlight $100 million to multi-billion dollar trades executed in their ETFs with very little impact to price—but we were encouraged to see an investor getting a block fill equal to 5.7x the ADV of our fund.
Conclusion
There are well over 2,000 ETFs and nearly 8,000 mutual funds in the US market. [4] Some might say that is too many. However, there are also 31,683 restaurants in Manhattan. [5] Choices are good, and generally lead to better results for the end customer (more innovation, lower prices, better match to preferences, etc.). Yes, wading through a multitude of choices can be a challenge for consumers. But with the proliferation of choices, we also have more freely available information that can help us make more informed decisions. Investors can lean on their advisers for assistance. And advisers can lean on their trading desk, brokerage partners, and issuers themselves to get the information they need.
Doing due diligence on an investment product is vitally important, whether it’s from a new issuer or an older firm. Above all, the investment strategy of the fund should fit the objectives and risk tolerance of the investor or client. The size of the fund or total assets of the issuer is far less important—although the larger issuers will certainly play this up as a “risk” factor. Liquidity should also be a consideration, but go beyond what shows on the screen and use the implied liquidity of the underlying holdings to make this determination–not the ADV.
[1] Hat tip to Dave Abner from WisdomTree, who worked with Bloomberg to develop the implied liquidity tool, based on his “Implied Daily Tradable Shares” (IDTS) concept.
[2] Bloomberg as of 11/16/2018
[3] Bloomberg time and sales data from 11/15/2018. There were 300 shares traded at $23.17 just ahead of the block that were executed just prior to the block, likely executed to satisfy the broker’s obligation under Regulation NMS (quote protection).
[4] Morningstar, via Forbes
[5] OpenTable as of 11/16/2018
Risks: Investments involve risk. Principal loss is possible. The Salt High truBeta™ US Market Fund ETF tracks the Salt High truBeta™ US Market Index which relies heavily on proprietary quantitative models as well as information and data supplied by third parties (Models and Data). The Fund has the same risks as the underlying securities traded on the exchange through the day. Redemptions are limited and often commissions are charged on each trade, and ETFs may trade at a premium or discount to their net asset value.
Shares of the ETF may be sold throughout the day on the exchange through any brokerage account. However, shares may only be redeemed directly from the Fund by Authorized Participants, in very large creation/redemption units. There can be no assurance that an active trading market for shares of an ETF will develop or be maintained. There can be no assurance that Shares will trade with any volume, or at all, on any stock exchange. In stressed market conditions, the liquidity of Shares may begin to mirror the liquidity of the Fund’s underlying portfolio holdings, which can be significantly less liquid than Shares.
Shares of any ETF are bought and sold at market price (not NAV) and may trade at a discount or premium to NAV. Shares are not individually redeemable from the Fund and may be only be acquired or redeemed from the fund in creation units.
An investor should consider the Fund’s investment objectives, risks, charges and expenses carefully before investing. The prospectus or summary prospectus contain this and other important information about the Fund and are available by clicking here or a hardcopy can be obtained by calling 646-757-1050. Please read the prospectus or summary prospectus carefully before Investing.
The Salt High truBeta™ US Market Fund ETF is distributed by Compass Distributors, LLC.
 Prev
Prev

Adaptive Indexing Starts with the Right Partner
Don't miss the next release
Be the first to know when Salt publishes its latest analytics, research, and insights
Disclaimers
The information provided herein is for information purposes only and is not intended to be and does not constitute financial, investment, tax or legal advice. All investments are subject to risks, including the risk of loss of principal. Past performance is not an indicator of future results.
The information and opinions contained in Salt’s blog posts, market commentaries and other writings are of a general nature and are provided solely for the use of Salt. This content is not to be reproduced, copied or made available to others without the expressed written consent of Salt. These materials reflect the opinion of Salt on the date of production and are subject to change at any time without notice. Due to various factors, including changing market conditions or tax laws, the content may no longer be reflective of current opinions or positions.
The information contained herein is not intended as a recommendation to buy, hold or sell any security. The investment performance described herein is simulated and does not reflect actual performance data. Actual investment performance may vary. There is no guarantee that an investment will be profitable and all investments bear the risk of partial or complete loss of capital. Past performance is not an indicator of future results.
Any market observations and data provided are for informational purposes only. Where data is presented that is prepared by third parties, such information will be cited, and these sources have been deemed to be reliable. However, Salt does not warrant the accuracy of this information. Salt and any third parties listed, cited or otherwise identified herein are separate and unaffiliated and are not responsible for each other’s policies, products or services.
Salt Financial LLC
44 Amogerone Crossway, #7910
Greenwich, CT 06830- 475-450-0500
- Contact Us