QQQ: Your Hidden Market Risk, Revealed
Ryan Poirier, ASA, CFA, FRM | Head of Applied Research | ryan@saltfinancial.com
The current market conditions are anything but predictable. Bulls and bears have been trading punches since the start of the fourth quarter. The S&P 500 has shaved off 280 points, or 9.6%, since September 30th. However, the bulls have had a few runs of their own such as the 6.5% surge from October 29th through November 7th and a 6% rally during the last week of November through December 3rd. What better time to better understand your market risk?
Market risk (beta, the sensitivity to market moves) is traditionally estimated using monthly returns over the past five years or from daily returns over the past one year. The former incorporates information from half a decade ago, which may not be applicable today. The latter adjusts for this and uses a higher frequency of data (daily) to be more responsive. Our proprietary beta measure, truBeta™, uses elements of both coupled with intraday data to be even more responsive. Based on our research, we observe an improvement in accuracy against the monthly and daily calculations of 52% and 41% [1], respectively, driven by the multiple frequencies of data and a more robust estimation algorithm.
Why is this improvement important? Using a better estimate allows investors to allocate their risk capital more efficiently. In other words, investors can better pinpoint their market risk exposure, under-allocating if the risk is higher than otherwise anticipated, or over-allocating if more risk was desired.
The Invesco QQQ Trust (Ticker: QQQ) is the largest ETF tracking the Nasdaq 100 index with over $60 billion under management. The Nasdaq 100 is often used as a proxy for technology stocks, with over two-thirds of the index allocated to Information Technology and Communications Services stocks and other Internet-powered Consumer Discretionary stocks such as Amazon and eBay. Technology-related stocks are traditionally more volatile than the overall market, with a beta typically greater than 1.0.
Standard measurements of beta for the QQQ imply a 1.15-1.18% change (using monthly and daily returns to estimate, respectively) for every 1% move in the SPDR S&P 500 ETF (SPY), in both the positive and negative direction. Our truBeta™ estimate shows a reading of 1.21%. It is easy to see the impact to investor portfolios, especially with 1% moves being more commonplace as of recently, occurring 57 times this year, or more than once per week. Based on the differences in how to estimate beta, the fund currently has about $18 million in unexpected variation for every 1% move of the SPY, calculated as the difference of the beta estimates multiplied by 1% of the total AUM [2].
Exhibit 1: Difference in truBeta™ Versus a Traditional 1-Year Beta Measurement
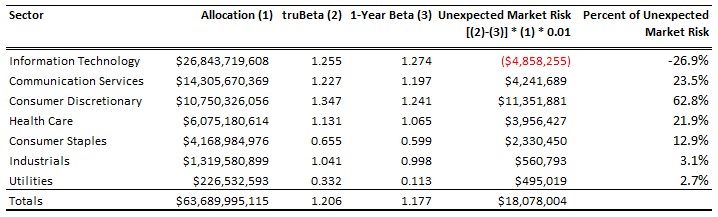
Source: Salt Financial. Data as of 12/7/2018. A detailed excel workbook with all relevant information can be found in the references.
Contrary to expectations, the Information Technology and Communications Services sectors are not the top sources of unexpected risk. Consumer Discretionary accounts for nearly two-thirds (63%) of the additional market risk despite being only 17% of the overall fund. Communication Services trails at 23%, while being 22% of the fund, representing a more equitable contribution. Technology is last in terms of additional risk. In fact, it exhibits almost $5 million less market risk than the market has estimated, driven by truBeta™ being lower than the 1-year beta.
Drilling further into the Consumer Discretionary sector reveals the culprit. A single company—Amazon—accounts for over 86% of the sector’s additional market risk, which translates into 54% of the $18 million of additional market exposure for the entire fund.

The Nasdaq 100 is a more concentrated index relative to other large cap indices such as the S&P 500. The top three companies—Microsoft, Apple, and Amazon—make up close to a third of the weight in the index. These three are also the largest stocks in the S&P 500—but make up less than 10% of the total weight. [3] The concentration and higher beta in QQQ can power moves to the upside, but also sting on the downside.
A more accurate beta forecast can help determine what portions of a portfolio (or in its entirety) warrant a second look because of unexpected market risk, reallocating to the appropriate risk level initially desired, up or down. But estimating this risk based on a less accurate and antiquated metric is analogous to licking your finger to see which way the wind is blowing two miles away. You will get a reading, but it may be the completely wrong direction, or severely under/overestimated on the speed.
QQQ Contribution Data Download
[1] For more information on truBeta™, visit www.saltfinancial.com to download the white paper describing the methodology and results. Inline text hyperlink also available above.
[2] For a detailed analysis of the Invesco QQQ Trust’s fund holdings, including relevant truBeta™ analysis, please see the excel spreadsheet.
[3] Source: Bloomberg, 12/10/2018.
The information provided herein is for information purposes only and is not intended to be and does not constitute financial, investment, tax or legal advice. All investments are subject to risks, including the risk of loss of principal. Past performance is not an indicator of future results.
The information and opinions contained in Salt’s blog posts, market commentaries and other writings are of a general nature and are provided solely for the use of Salt. This content is not to be reproduced, copied or made available to others without the expressed written consent of Salt. These materials reflect the opinion of Salt on the date of production and are subject to change at any time without notice. Due to various factors, including changing market conditions or tax laws, the content may no longer be reflective of current opinions or positions.
The information contained herein is not intended as a recommendation to buy, hold or sell any security. The investment performance described herein is simulated and does not reflect actual performance data. Actual investment performance may vary. There is no guarantee that an investment will be profitable and all investments bear the risk of partial or complete loss of capital. Past performance is not an indicator of future results.
Any market observations and data provided are for informational purposes only. Where data is presented that is prepared by third parties, such information will be cited, and these sources have been deemed to be reliable. However, Salt does not warrant the accuracy of this information. Salt and any third parties listed, cited or otherwise identified herein are separate and unaffiliated and are not responsible for each other’s policies, products or services.