Psst…meet the Steve Kerr of Low Volatility
Ryan Poirier, ASA, CFA, FRM | Head of Applied Research | ryan@saltfinancial.com
One year ago, the Salt Low truBeta™ US Market Index joined the fight against volatility. [1] The team is already stacked with players like the MSCI USA Minimum Volatility Index and S&P 500 Low Volatility Index–the Michael Jordan and Scottie Pippen of the space. They command the spotlight and are titans with respect to AUM tracking their respective strategies.
The ’95-’96 Chicago Bulls were great in many regards. Jordan led the show without a doubt. However, people often forget about the supporting cast that pushed them over the top. Steve Kerr ranked second in 3-point field goal percentage and led the league in assists-to-turnover. He played side by side with two legends, showing the ability to be effective at the highest professional level. Yet his effectiveness was derived from a differentiated approach to scoring, rebounding, or passing.
The Salt Low truBeta™ US Market Index is the Steve Kerr to the strategies from MSCI and S&P. It has the same championship aspirations in terms of lower volatility. It has the same potential to score points, with volatility over the past year of just 11.58% compared to 16% for the S&P 500 and 12.15% and 11.59% for the MSCI and S&P flavors, respectively. [2] But it provides a differentiated way to implement a low volatility strategy to seek outperformance.
Energy, Health Care, and Real Estate were the three sectors with the highest return contribution for the Salt Low truBeta™ Index over the past year. Utilities and Real Estate led the charge for both MSCI and S&P’s low-vol indices with Consumer Discretionary and Financials rounding out the podium, respectively.
Three Most Impactful Sectors Over The Past Year
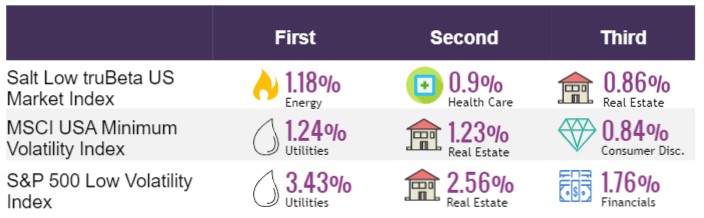
Source: Salt Financial.
S&P’s index was driven by two persistent sector overweights–Utilities and Real Estate. These sectors traditionally perform well when interest rates fall, playing to their bond-like characteristics. The 10-Year Treasury yield was hovering around 3.25% a year ago and has since fallen to 1.7%, with potentially another rate cut in the final quarter of 2019. [3]
MSCI’s index methodology employs a holistic approach when targeting a minimum volatility portfolio. Securities with relatively higher volatility may be included if they zig while others are zagging. Combined with sector constraints, this makes outsized return contributions rarer than in S&P’s version.
The entire NBA was on high alert when Jordan and Pippen came to town. But with all the attention on the two stars, opportunities opened up for other players to step up and perform. The same could be said for Utilities and Real Estate soaking up all the attention in a falling interest rate environment—other sectors have the potential to step in and score points.
In the first quarter, Binky Chadha, Deutsche Bank’s chief strategist, noted that “consumer staples are a preferred tactical play now because other defensive sectors like real estate investment trusts and utilities have already priced in the drop in rates”. [4] With the spotlight fully on Utilities and Real Estate, a low volatility strategy with differentiated sector exposure may be a recipe for success–much like Steve Kerr added a different threat when the big guns for the Bulls were having an off day.
The Salt Low truBeta™ US Market Index is heavily overweight in Consumer Staples. Its allocation is twice that of the MSCI or S&P version. Utilities and Real Estate are also well represented in the index but with a third less weight compared to the S&P version. The MSCI strategy is also tilted towards these more defensive sectors but uses a sector constraint mechanism to keep its allocation closer to the broader market. The Salt index strikes a balance between the two approaches, allowing for more concentration than the broader market but placing an ultimate cap of no more than 30% in any one sector.
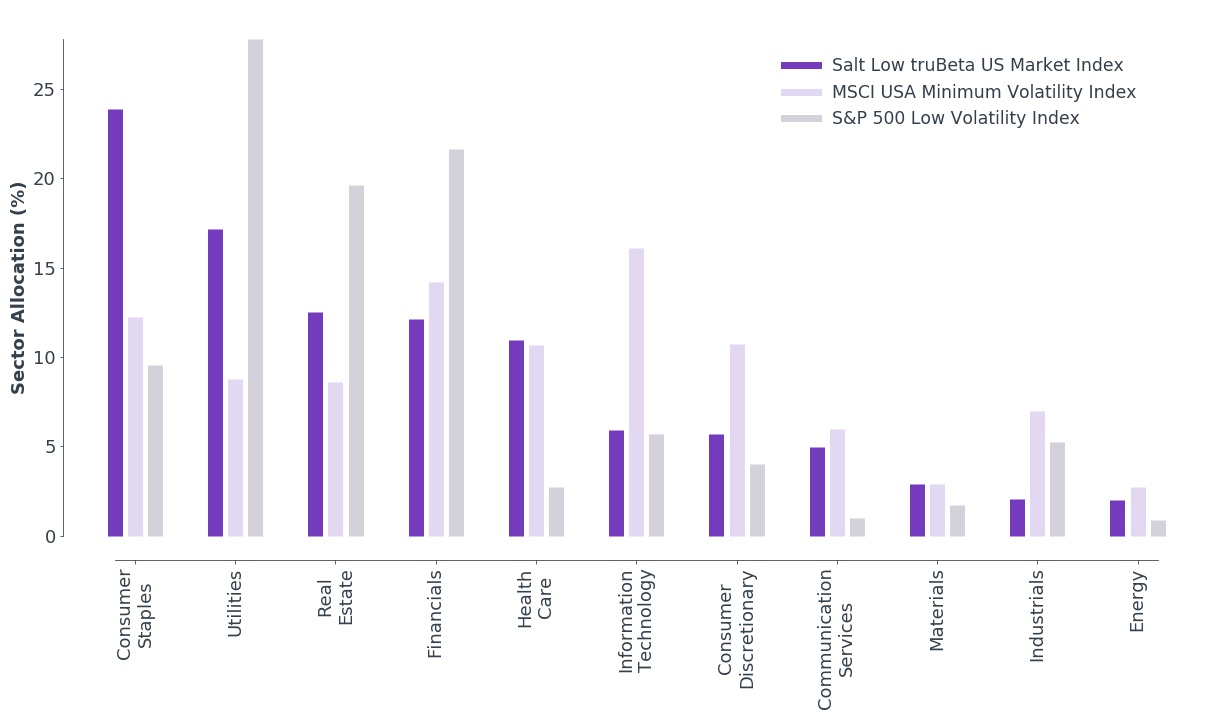
Source: Salt Financial. Sector classification follows GICS.
Most investors are familiar with the relationship between traditional bond-like sectors such as Utilities and Real Estate and interest rates. Ultimately, this potential crowding into a well-known tailwind effect may open up the court for another option on the team, much like the ’95-’96 bulls and Steve Kerr. He added a different flavor to the team while competing at the highest level, much like the Salt Low truBeta™ US Market Index in the low volatility space.
[1] The Salt Low truBeta™ US Market Index has an inception date of 10/23/2018.
[2] Bloomberg.
[3] https://www.nytimes.com/2019/09/18/business/economy/fed-interest-rate-cut.html
[4] https://www.cnbc.com/2019/03/27/these-stocks-are-seen-as-a-good-bet-when-interest-rates-fall.html
 Prev
Prev

Adaptive Indexing Starts with the Right Partner
Don't miss the next release
Be the first to know when Salt publishes its latest analytics, research, and insights
Disclaimers
The information provided herein is for information purposes only and is not intended to be and does not constitute financial, investment, tax or legal advice. All investments are subject to risks, including the risk of loss of principal. Past performance is not an indicator of future results.
The information and opinions contained in Salt’s blog posts, market commentaries and other writings are of a general nature and are provided solely for the use of Salt. This content is not to be reproduced, copied or made available to others without the expressed written consent of Salt. These materials reflect the opinion of Salt on the date of production and are subject to change at any time without notice. Due to various factors, including changing market conditions or tax laws, the content may no longer be reflective of current opinions or positions.
The information contained herein is not intended as a recommendation to buy, hold or sell any security. The investment performance described herein is simulated and does not reflect actual performance data. Actual investment performance may vary. There is no guarantee that an investment will be profitable and all investments bear the risk of partial or complete loss of capital. Past performance is not an indicator of future results.
Any market observations and data provided are for informational purposes only. Where data is presented that is prepared by third parties, such information will be cited, and these sources have been deemed to be reliable. However, Salt does not warrant the accuracy of this information. Salt and any third parties listed, cited or otherwise identified herein are separate and unaffiliated and are not responsible for each other’s policies, products or services.
Salt Financial LLC
44 Amogerone Crossway, #7910
Greenwich, CT 06830- 475-450-0500
- Contact Us