October: A Trick or Treat for Bears?
Ryan Poirier, ASA, CFA, FRM | Head of Applied Research | ryan@saltfinancial.com
Halloween was yesterday, and October lived up to its reputation as a scary month for the markets with the S&P dropping 6.84% and the Nasdaq 100 tumbling 9.16%. We have seen worse in terms of percentage declines, but October 2018 ranked tied for second in terms of the number of down days for the market in a month since 1970. In fact, there have been no other Octobers with more down days. Interesting to note that October 1987 is not on this list. Despite the big decline on Black Monday, the surrounding days were relatively mixed with only 11 of the other 21 days recording a loss.
Exhibit 1: Count of Negative Days in Respective Months
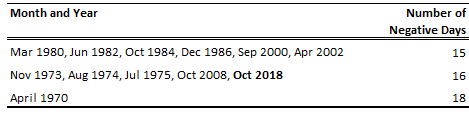
Source: Bloomberg, Salt Calculations. Data from January 1, 1970 through October 31, 2018.
In contrast to the recent rough ride, the US stock market was unusually tranquil for all of last year, likely leading to investors feeling more complacent. With 401 out of 505 stocks in the S&P 500 producing a positive total return, it was easy to sit back with inflated confidence and think you’re Warren Buffett. The VIX, which acts as the market’s fear gauge, took most of the year off, recording 52 days with a closing value of 10 or lower, something only done nine times in its entire history leading up to 2017. It made two new all-time lows and averaged 11.09 for the entire year. Further, up days were more prevalent than down days at a rate of 4:3, ranking 6th best out of the last 49 years.
The powerful 300% surge in the S&P 500 since the bottom of the Global Financial Crisis in March 2009 could mean the bull is tired and tempt the bears to pounce. Without even considering conventional valuation metrics, a quick look at the nearly vertical rise on a chart might suggest the market is overly extended on a historical basis. But looking at a logarithmic scale—which adjusts the market moves in terms of percentage instead of level—gives the current run some context and makes it look a lot more ordinary. Exhibit 2 (panel A) shows this difference in perception between the two scales.
Exhibit 2: Historical Time Series of Cumulative Performance and Risk Metrics
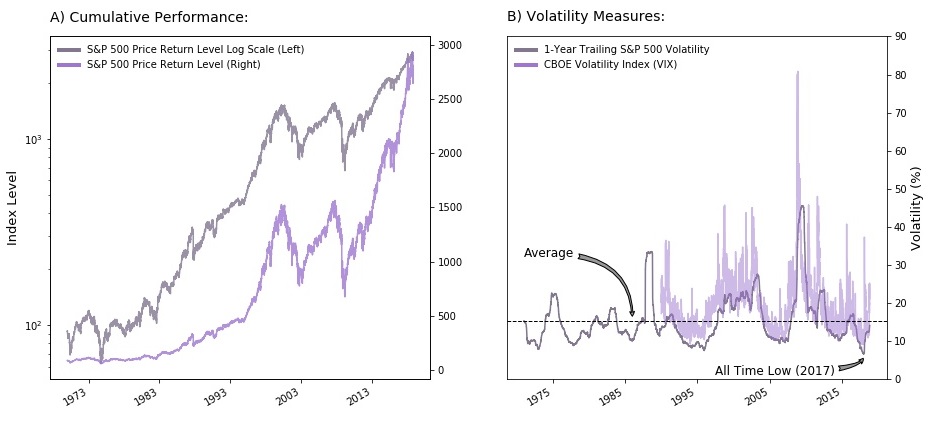
Source: Bloomberg, Salt Calculations. Data from January 1, 1970 through October 31, 2018. For informational purposes only. It is not possible to invest directly in an index.
The second half of 2017 saw the trailing one-year historical volatility in the S&P 500 sink to an all-time low of 6.66%, well below its long-term average of 15.4%. Many analysts and investors have been expecting some reversion to the mean, but that process can take a long time to materialize. We witnessed some of this in February as the market experienced a large uptick in volatility, leading to the ultimate demise of the XIV ETF, which was a popular and profitable bet by investors against volatility for several years. Since then, trade wars, geopolitical tensions, and rising interest rates have helped push the trend back towards the long-term average, as seen in Exhibit 2 (panel B).
The average daily return for the S&P 500 from January 1st, 1970 to October 31st, 2018 was 3.3 basis points. Through Halloween, this year has recorded nine down days that exceeded -2.07% (two standard deviations below the mean), with number ten just missing by only 1.6 basis points. Conversely, only two trading days have been seen over a 2.14% return on the upside (two standard deviations above the mean). If the normal distribution tells us anything, we are not due for another 2.07% decline for the rest of 2018 and well into 2019. However, historical returns tend to have fatter tails than a normal distribution, meaning the nine extreme down days thus far in 2018 are likely a more routine occurrence than anomalous.
The juxtaposition of last year’s calm makes a stark comparison to the now two spikes in volatility we’ve seen so far in 2018. But while the number of extreme down days for the year does not appear to be too far out of the ordinary, our 16 days in the red for October still rank pretty high historically. Is there a silver lining? What happens to the market in the months following one of these down day months?
Exhibit 3: Average Performance Following Months with High Amounts of Negative Days
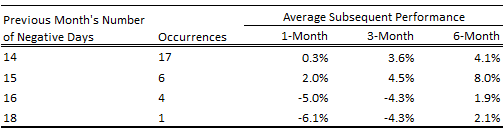
Source: Bloomberg, Salt Calculations. Data from January 1, 1970 through October 31, 2018.
Average returns following 14 or 15 negative days in a month since 1970 were higher one, three, and six months later, scoring gains in the mid-single digits. Markets posted more negative average returns following 16 or 18 down days in a month, although the sample size is very small (only four occurrences of 16 in just shy of 49 years and just a single occurrence of 18 days).
The bulls still have reason to hold out hope. Market returns following two of the four 16 down-day months (August 1974 and July 1975) topped 13% six months later compared to losses of over 9% for the other two (November 1973 and October 2008). After October’s fright fest, investors might welcome 50-50 odds on higher returns in the first half of 2019.
The information provided herein is for information purposes only and is not intended to be and does not constitute financial, investment, tax or legal advice. All investments are subject to risks, including the risk of loss of principal. Past performance is not an indicator of future results.
The information and opinions contained in Salt’s blog posts, market commentaries and other writings are of a general nature and are provided solely for the use of Salt. This content is not to be reproduced, copied or made available to others without the expressed written consent of Salt. These materials reflect the opinion of Salt on the date of production and are subject to change at any time without notice. Due to various factors, including changing market conditions or tax laws, the content may no longer be reflective of current opinions or positions.
The information contained herein is not intended as a recommendation to buy, hold or sell any security. The investment performance described herein is simulated and does not reflect actual performance data. Actual investment performance may vary. There is no guarantee that an investment will be profitable and all investments bear the risk of partial or complete loss of capital. Past performance is not an indicator of future results.
Any market observations and data provided are for informational purposes only. Where data is presented that is prepared by third parties, such information will be cited, and these sources have been deemed to be reliable. However, Salt does not warrant the accuracy of this information. Salt and any third parties listed, cited or otherwise identified herein are separate and unaffiliated and are not responsible for each other’s policies, products or services.