Gimme Shelter: High Beta Stocks Tend to Outperform When Rates Rise
Ryan Poirier, ASA, CFA, FRM | Head of Applied Research | ryan@saltfinancial.com
- Many investors fear rising rates could lead to poor performance for stocks, although the link between the two is not as clear-cut as most would expect
- Historical analysis from 1990 through September 2018 shows high beta outperforms low volatility in months when interest rates are rising [1]
- Instead of abandoning stocks, an allocation in higher-beta sectors that have historically performed better can potentially help your portfolio
The Federal Reserve increased rates eight times in the past three years, after being effectively zero for the prior seven years. Currently sitting at 2.25% [2], many believe rates have further to rise. Standard macroeconomic theory suggests that future interest rate hikes will likely depress future stock market returns.
In a rising rate scenario with an assumption that lower equity returns will follow, it is no surprise that advisors and investors are considering more conservative equity allocations. But does this risk aversion directly translate to underweighting or exiting completely from equities? Or should investors shift to more “defensive” sectors that are viewed to be less sensitive to market fluctuations? While playing defense sounds like a good idea in theory, the bond-like characteristics of traditional lower volatility stock sectors (e.g., Utilities and Consumer Staples) make them relatively more susceptible to rising interest rates. The result is negative excess return vis a vis the broad market, all else being equal. But does this imply that the opposite trade—investing in high-beta stocks—will outperform during periods of rising rates? Using the S&P 500 Index as the broad market, the S&P 500 Low Volatility Index as a low-vol proxy, and the S&P 500 High Beta Index as a high-beta proxy, we were surprised to find that higher beta tends to outperform both low volatility and the broader market in months when rates are rising, based on the historical data.
To measure the impact of rates on equity returns, we calculated the sensitivity of these portfolios (low-vol and high-beta) by regressing the monthly excess returns over the S&P 500 against the monthly changes in 10-year Treasury rates. Low volatility had a slope coefficient of -3.05%, implying a negative relation with changes in the 10-year rate. In other words, for every 1% increase in rates, low volatility underperforms the broad market by 3.05%, on average. High beta, in contrast, displays a monthly excess return of positive 5.1%, on average, given a 1% increase in rates. Both slope coefficients are significant at a 99% confidence level. Exhibit 1 shows these sensitivities along with the average excess return during rising and falling interest rate environments.
Exhibit 1: Interest Rate Sensitivity and Average Excess Return for Low Volatility and High Beta During Rising and Falling Interest Rates
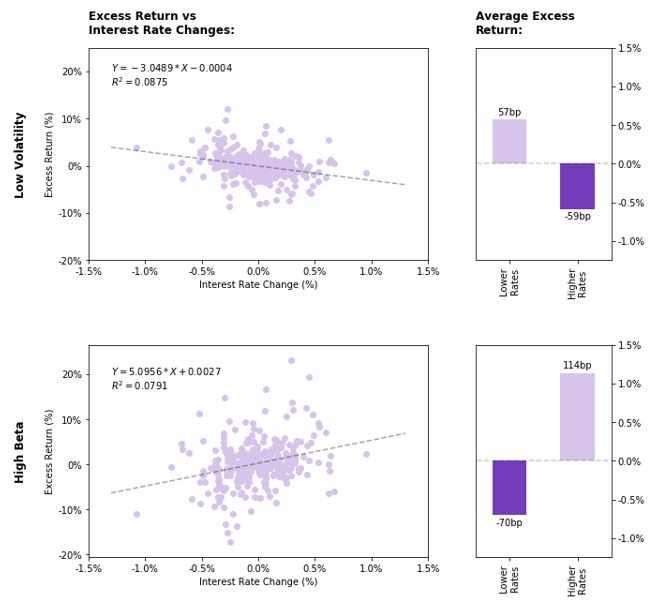
Source: Bloomberg, Salt Calculations. Data from November 30th, 1990 till September 30th, 2018. Index returns are total return, including dividend reinvestment. Past performance is not indicative of future results. Actual outcomes in a rising rate environment may vary from the sensitivity charts shown above.
Potentially more interesting is the magnitude at which high beta responded to interest rates. In months where rates rose, high beta stocks outperformed the S&P 500 by 114 basis points (bps), on average (see Exhibit 1, right column). In contrast, lower volatility stocks only outperformed the S&P 500 by 57 bps in declining rate months. Furthermore, the differential in performance in rising rate months averaged 173 bps for high beta over low volatility compared to just 127 bps for lower volatility over high beta in the lower rate months.
While the relationship between low volatility and rising interest rates is widely covered by analysts, the high beta advantage flies under the radar. For example, a Google search for “low volatility during rising interest rates” yields roughly six times more results than “high beta during rising interest rates”. Although the relationship may be less familiar in the market, the data tell a concise story. Faced with rising interest rates and the desire to remain fully invested in equities, paradoxically assuming more risk with higher beta stocks can potentially be better for returns.
The popular assumption that all rising rate environments are bad for stocks is not supported by the evidence. According to a recent study by Vanguard [3], during the 11 periods of rising rates from 1967 through 2017, S&P 500 returns were negative in only one (February through July 1974). The other ten were positive and most were close to or exceeded the 10% annualized return for the market since 1925. While a return to the inflationary late 1970s would be disastrous for stocks, there is little evidence to support this scenario either. The latest CPI figures indicate an annualized 2.7% inflation rate, which is marginally higher than the 2.5% average since 1990 [4].
Unless we are heading back to the days of bell bottoms and gas lines, a rise in rates to some moderate level in response to higher economic growth may not be the worst thing in the world for equities. Combined with some tactics to minimize the risk in bonds such as shortening duration, an allocation to some higher beta stocks can help diversify your portfolio and stay invested as interest rates tick up. As the saying goes, it’s all about time in the market, not timing the market.
[1] Salt Financial Calculations
[2] Bloomberg
[3] “Looking past the Fed’s next rate hike”, Vanguard Blog, September 24, 2018 (https://vanguardblog.com/2018/09/24/looking-past-the-feds-next-rate-hike/)
[4] US CPI Urban Consumers YoY NSA, Bureau of Labor Statistics via Bloomberg
The information provided herein is for information purposes only and is not intended to be and does not constitute financial, investment, tax or legal advice. All investments are subject to risks, including the risk of loss of principal. Past performance is not an indicator of future results.
The information and opinions contained in Salt’s blog posts, market commentaries and other writings are of a general nature and are provided solely for the use of Salt. This content is not to be reproduced, copied or made available to others without the expressed written consent of Salt. These materials reflect the opinion of Salt on the date of production and are subject to change at any time without notice. Due to various factors, including changing market conditions or tax laws, the content may no longer be reflective of current opinions or positions.
The information contained herein is not intended as a recommendation to buy, hold or sell any security. The investment performance described herein is simulated and does not reflect actual performance data. Actual investment performance may vary. There is no guarantee that an investment will be profitable and all investments bear the risk of partial or complete loss of capital. Past performance is not an indicator of future results.
Any market observations and data provided are for informational purposes only. Where data is presented that is prepared by third parties, such information will be cited, and these sources have been deemed to be reliable. However, Salt does not warrant the accuracy of this information. Salt and any third parties listed, cited or otherwise identified herein are separate and unaffiliated and are not responsible for each other’s policies, products or services.