Getting High on High Beta
Ryan Poirier, ASA, CFA, FRM | Head of Applied Research | ryan@saltfinancial.com
Last year was a run up year, with the S&P 500 surging 31.49%. Yet some factor indices performed much better and some worse. High beta was the runaway winner last year. Investors simply needed more market exposure for their given dollar to achieve superior returns in 2019. Beta was king, and more of it made you look like a star manager.
Excess Return of Various Factor Indices During 2019
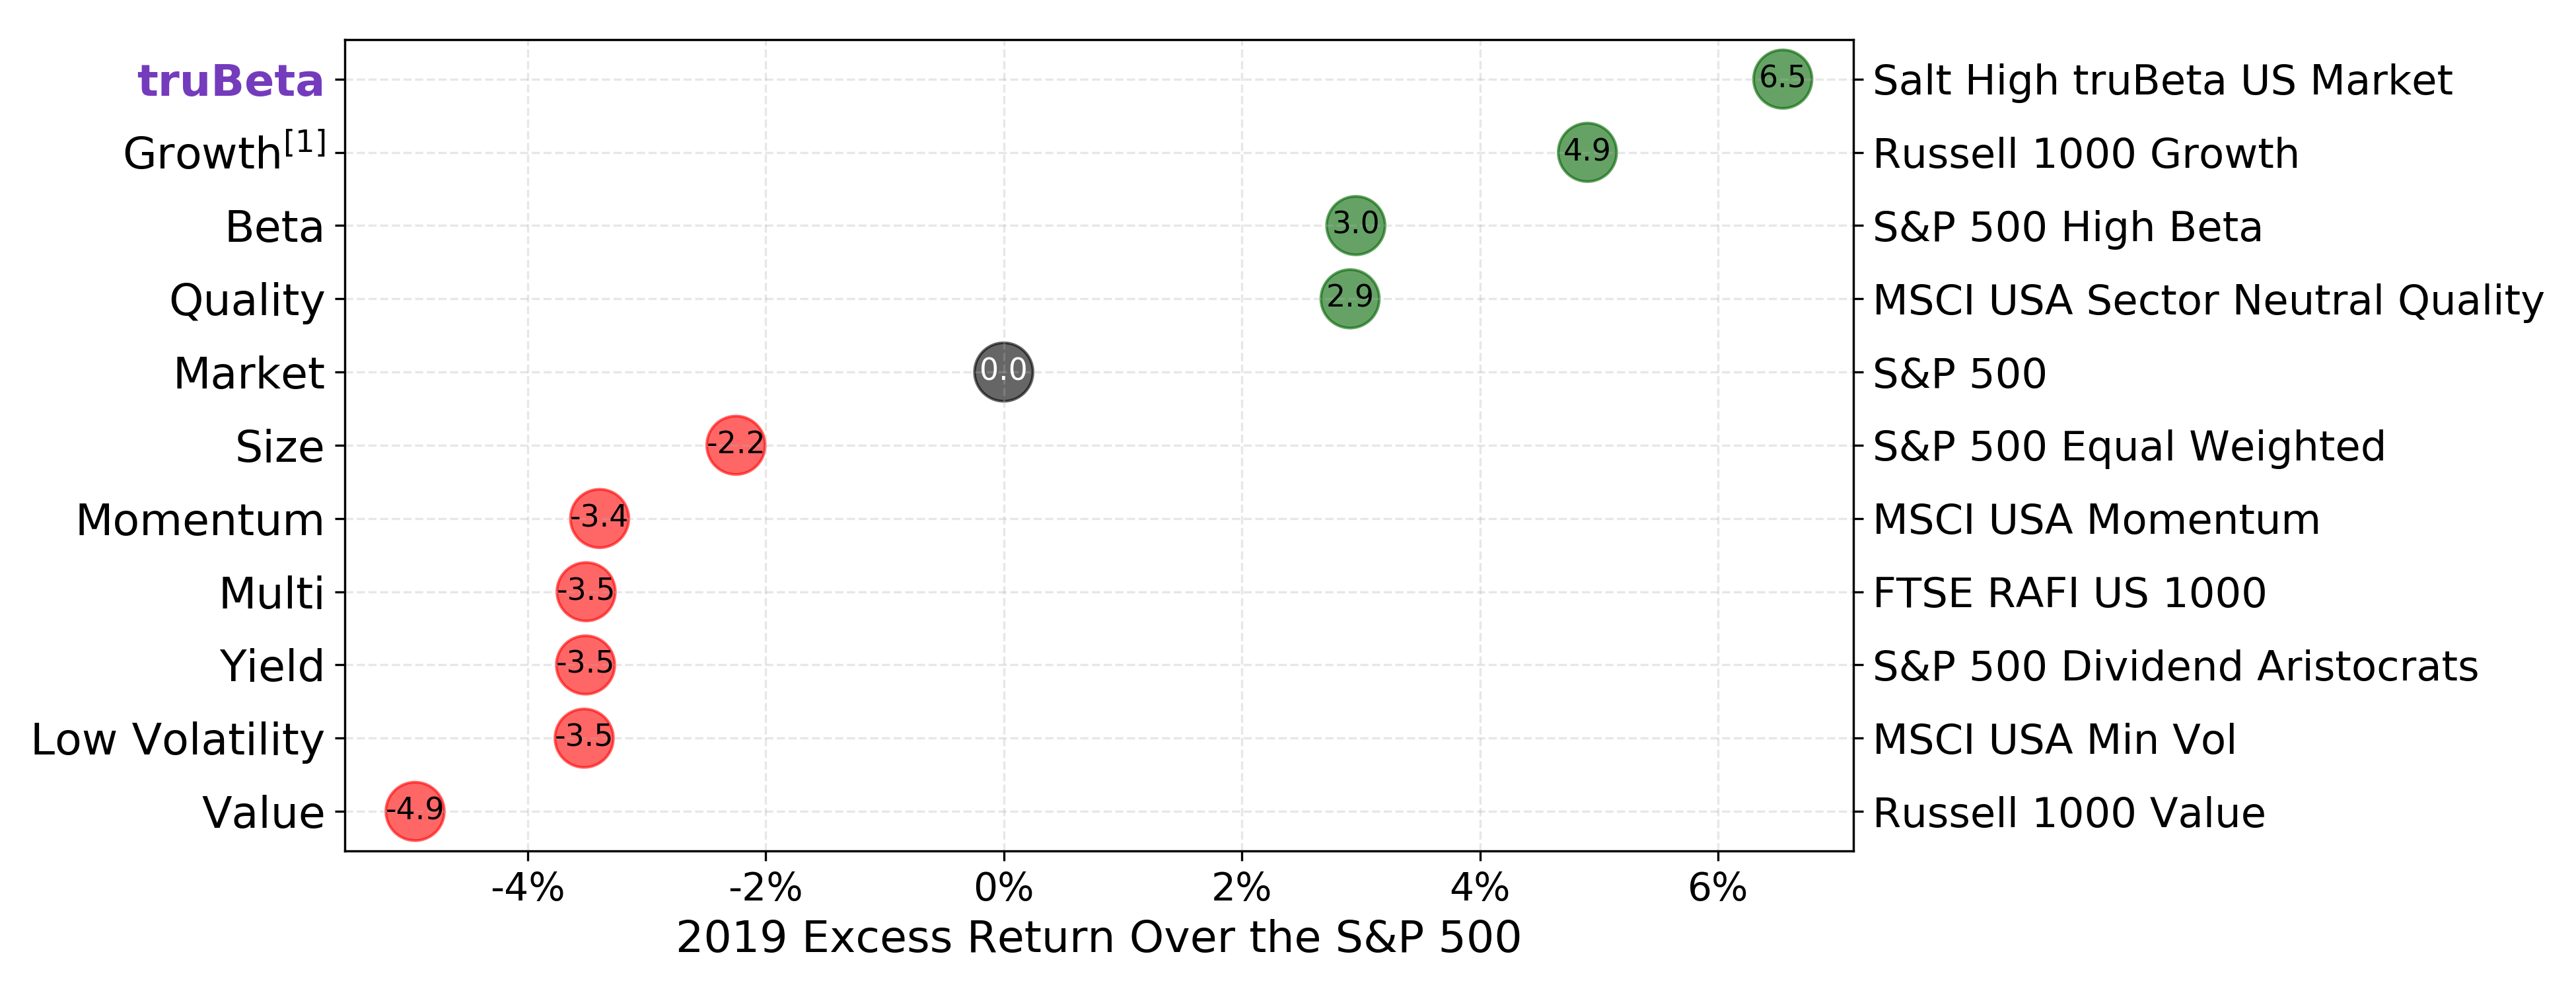
Source: Salt Financial. Comparison indices are leading factor indices in each category.
Among the widely recognized factor indices, the Salt High truBeta™ US Market Index led the pack with a return of 38.03%, outpacing the S&P 500 by 6.5%, without taking any large sector bets or using leverage. The S&P 500 High Beta Index made the honorable mention at 34.44%, resulting in an extra bump of 2.9%. Meanwhile, the S&P 500 itself had a 6-year best at 31.49%.
Just because two indices target the same factor does not mean they are of the same caliber. The index methodology matters when constructing factor portfolios, and high beta is no different. [1] The Salt High truBeta™ US Market Index tracks a basket of high beta securities, much like the S&P 500 High Beta Index. However, there are two important differences between the two:
- The Salt High truBeta™ US Market Index uses a proprietary forward-looking beta (truBeta™) versus the historical beta in the S&P version. You wouldn’t drive forward with the rear-view mirror, so why construct risk-based portfolios relying exclusively on historical data, or past risk? [2]
- Correlation matters in a high beta portfolio. High beta with near zero correlation implies extremely high volatility, a potentially undesirable trait. Correlation is where the rubber meets the road, so you need enough of it to get a jump on the competition when the light turns green.
The latter is implicitly expressed by the former. Estimating future beta implies modeling future correlation and future volatilities in one fell swoop.
Increased Market Sensitivity of High Beta Portfolios
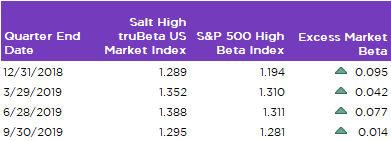
Source: Salt Financial. Market sensitivity is measured by truBeta™, Salt Financials’ proprietary forward-looking beta measure.
The Salt High truBeta™ Index’s beta outranked that of the S&P version at all four quarterly checkpoints during the last year. It was ready to capitalize when the S&P 500 gave the green light for a run up.
truBeta™ Provided More Benefit as the S&P 500 Heated Up
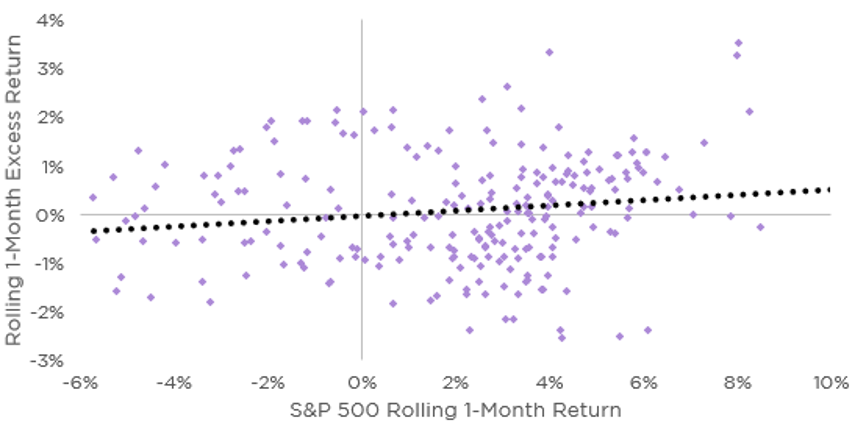
Source: Salt Financial. Data from Dec 31st, 2018 to Dec 31st, 2019. Rolling 1-Month Excess Return is defined as the trailing 1-Month return of the Salt High truBeta™ US Market Index (minus) that of the S&P 500 High Beta Index.
It also provided increased excess return as the S&P 500 notched higher. In other words, there was a larger disparity, favoring the Salt High truBeta™ Index, during bigger rallies than for smaller ones. For each incremental 1% monthly advance in the S&P 500, the Salt High truBeta™ Index climbed an extra 5 basis points more than the S&P version.
All dragsters are designed to go fast in one direction. However, you might find yourself spinning your wheels at the starting line when the light goes green if you’re not careful. There is nothing more frustrating than having the correct market view and leaving returns on the table because you didn’t check under the hood first. The moral of the story: make sure the rubber meets the road when investing in high beta.
[1] Growth investing is another example where the methodology construction played a paramount role in 2019. The difference in performance between the Russell 1000 Growth and S&P 500 Growth (runner-up) was 5.26%, which was entirely driven by the runner-up index missing out on Apple’s stellar 2019 performance.
[2] For additional information on truBeta™, see the Salt Financial white paper “Quarterly Beta Forecasting with Multiple Return Frequencies”, available at https://tinyurl.com/y89xjjxk.
 Prev
Prev

Adaptive Indexing Starts with the Right Partner
Don't miss the next release
Be the first to know when Salt publishes its latest analytics, research, and insights
Disclaimers
The information provided herein is for information purposes only and is not intended to be and does not constitute financial, investment, tax or legal advice. All investments are subject to risks, including the risk of loss of principal. Past performance is not an indicator of future results.
The information and opinions contained in Salt’s blog posts, market commentaries and other writings are of a general nature and are provided solely for the use of Salt. This content is not to be reproduced, copied or made available to others without the expressed written consent of Salt. These materials reflect the opinion of Salt on the date of production and are subject to change at any time without notice. Due to various factors, including changing market conditions or tax laws, the content may no longer be reflective of current opinions or positions.
The information contained herein is not intended as a recommendation to buy, hold or sell any security. The investment performance described herein is simulated and does not reflect actual performance data. Actual investment performance may vary. There is no guarantee that an investment will be profitable and all investments bear the risk of partial or complete loss of capital. Past performance is not an indicator of future results.
Any market observations and data provided are for informational purposes only. Where data is presented that is prepared by third parties, such information will be cited, and these sources have been deemed to be reliable. However, Salt does not warrant the accuracy of this information. Salt and any third parties listed, cited or otherwise identified herein are separate and unaffiliated and are not responsible for each other’s policies, products or services.
Salt Financial LLC
44 Amogerone Crossway, #7910
Greenwich, CT 06830- 475-450-0500
- Contact Us