Does Market Timing with Trend-Following Signals Work? A Statistical Perspective
Ryan Poirier, ASA, CFA, FRM | Head of Applied Research | ryan@saltfinancial.com
Market timing sounds great in theory. Who wouldn’t want to be in the market on the way up and out before the market turns south? The SPDR S&P 500 ETF (SPY) has recently moved back above its 200-day moving average, potentially tempting investors towards these types of strategies. But are they a reliable strategy or simply a marketing gimmick?
Pacer’s Trendpilot is a leading provider of packaged strategies designed to time the market based on trend-following signals with several ETFs available in the market, serving as a bogey for all investors looking to implement a market timing strategy, not just those invested with Pacer. Launched back in 2015, these ETFs are designed to be fully exposed to the benchmark equity index when the trend is accelerating and allocated to Treasury bills in a deteriorating market trend. Since launch, they have done exactly as advertised, switching to Treasury bills three separate times. The most recent switch was on October 31st, 2018, going from 100% market exposure to 100% Treasury bills.
Was Moving to Cash the Correct Decision?
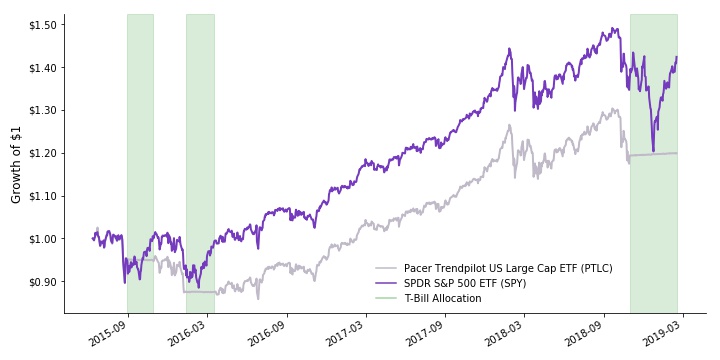
Source: Bloomberg.
PTLC, the largest of the suite with $1.7 Billion in assets, is closing in on its fourth birthday. In this time, it has returned 5.06% on an annualized basis, trailing SPY‘s annualized return of 10.10% over the same time period. [1] However, the objective of a market timing strategy using trend following is to reduce volatility while not giving back too much of the return, thus increasing the risk-adjusted return. PTLC did indeed have lower volatility over this period (11.1% vs. 13.9%). However, the three switches to Treasury bills dramatically lowered the return, making its risk-adjusted return come in far lower than that of SPY (Sharpe Ratio of 0.43 vs. 0.70).
Giving PTLC the benefit of the doubt, a four-year time frame isn’t all that long. It also coincides with a strong period for equities, offering PTLC limited opportunity to shine during a less benign market environment. However, even if the ETF had been around for 10 years, this would still only represent one possible experience (or path) for an investor to judge the strategy’s robustness. Using a single path is to assume the future will unfold exactly as it has in the past, a poor assumption at best. The purpose of a backtest is not to describe the past performance. Rather, it is meant to form an opinion about the strategy’s characteristics in the future before putting money at risk.
Statistically speaking, there is no way to form an opinion as to whether a market-timing strategy increases risk-adjusted returns with only one path. For example, flipping heads once does not provide enough information to assert whether you have a fair coin. However, flipping the same coin 200 separate times, resulting in 99 heads and 101 tails, tells you with almost certainty that it is a fair coin. One single backtest (or live experience) does not provide enough information to assert whether your strategy is a hero or a zero. Therefore, a simulation can be applied in a similar manner to that of the coin example to form an opinion on the efficacy of market timing a trend-following signal.
Bootstrapping, a statistical resampling technique, randomly selects chunks of a known return series, such as the S&P 500, and then stitches them together to make a new time series. The resulting time series represents one possible investor experience. Moreover, it keeps some of the well-known behaviors of markets intact. First, markets have fat tails. This means you should expect large market moves, both positive and negative, to have a greater probability than a normal distribution would imply. Second, they exhibit a characteristic known as autocorrelation. Simply put, this means there is some tendency for tomorrow’s return to be influenced by today’s return.
Constructing a new time series multiple times enables a comparison of buy-and-hold versus market timing over different paths, each having unique entry and exit points regarding the trend. The most widely used trend signal is the 200-day simple moving average. A positive trend is indicated by the equity index (S&P 500 Total Return) being above the moving average; we are long the equity index in this case. A negative trend is when the equity index is below the moving average, indicating a move to cash. We test this strategy over 100,000 simulated 10-year holding periods using the bootstrapping method.
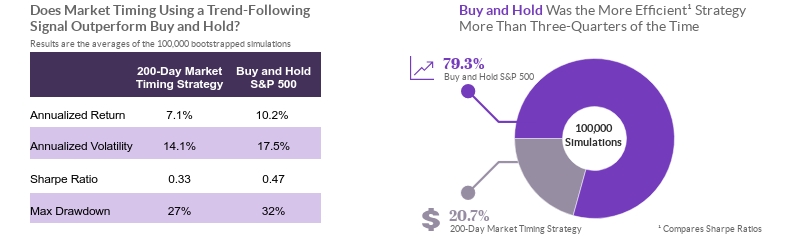
Source: Bloomberg, Ken French Data Library, Salt Calculations. Data from December 31st, 1988 till December 31st, 2018. Simulation results are constructed using a 3-day moving block bootstrap method. The attached excel file provides an example of this technique.
The results tell a concise story. Using the trend indicator to switch between equities and cash, defined as 1-month T-bills, does lower the volatility when compared to a buy-and-hold strategy. However, they also show that returns take a sizable hit, resulting in a slightly lower average Sharpe Ratio. All differences are statistically different from zero at the 99% level, implying there is an actual economic difference between these two strategies.
One positive takeaway is that moving in and out of the equities reduced the maximum expected drawdown from about 32% to 27%. Some investors cannot stomach the sight of their account values dropping in times of market turmoil, making this a potentially good alternative despite the 3% lower expected return. But for those investors that understand the long-term benefit of staying the course, a buy-and-hold strategy appears to have the leg up on this simple market-timing strategy.
The live track record of PTLC is not nearly long enough to argue it will underperform over the long term. But even with a longer live history, this is only one possible investor experience. Using a simulation approach that accounts for more randomness in market dynamics allows us to build a statistical opinion around the efficacy of not just this strategy, but any back-tested rules-based strategy. The data suggests the strategy behind PTLC’s underperformance since inception, in terms of both lower absolute returns and lower Sharpe Ratios, is consistent with what long-term investors should expect. That said, sometimes the best investing strategy is the one the investor can stick with for the long term.
[1] Source: Bloomberg, data as of 2/15/2019
Simulation Example Download
 Prev
Prev

Adaptive Indexing Starts with the Right Partner
Don't miss the next release
Be the first to know when Salt publishes its latest analytics, research, and insights
Disclaimers
The information provided herein is for information purposes only and is not intended to be and does not constitute financial, investment, tax or legal advice. All investments are subject to risks, including the risk of loss of principal. Past performance is not an indicator of future results.
The information and opinions contained in Salt’s blog posts, market commentaries and other writings are of a general nature and are provided solely for the use of Salt. This content is not to be reproduced, copied or made available to others without the expressed written consent of Salt. These materials reflect the opinion of Salt on the date of production and are subject to change at any time without notice. Due to various factors, including changing market conditions or tax laws, the content may no longer be reflective of current opinions or positions.
The information contained herein is not intended as a recommendation to buy, hold or sell any security. The investment performance described herein is simulated and does not reflect actual performance data. Actual investment performance may vary. There is no guarantee that an investment will be profitable and all investments bear the risk of partial or complete loss of capital. Past performance is not an indicator of future results.
Any market observations and data provided are for informational purposes only. Where data is presented that is prepared by third parties, such information will be cited, and these sources have been deemed to be reliable. However, Salt does not warrant the accuracy of this information. Salt and any third parties listed, cited or otherwise identified herein are separate and unaffiliated and are not responsible for each other’s policies, products or services.
Salt Financial LLC
44 Amogerone Crossway, #7910
Greenwich, CT 06830- 475-450-0500
- Contact Us