Can’t Drive Forward Using Only the Rearview Mirror
Ryan Poirier, ASA, CFA, FRM | Head of Applied Research | ryan@saltfinancial.com
Risk is often viewed in the rearview mirror. Wall Street typically defines risk in terms of volatility—the uncertainty of how an asset varies in price. It should come as no surprise that there are no risks in past data. There is no uncertainty the investment will lose value in the past; it either did or did not lose value over some past period of time. All of the real risk—whether measured as variability of price or the odds you lose money permanently—is forward-looking.
Risk measures in finance traditionally use standard deviation over a past period such as the prior 252 days (1 year) to assess the risk for the near future. The problem is some aspects of the company can materially change over this time period, potentially rendering some or all those datapoints irrelevant. For example, recent chatter as to whether Amazon should spin off its AWS business may have led to the stock becoming more volatile in late 2018. Recent changes in business drivers can fail to show up in conventional risk measures until it is too late.
Utilizing a dynamic risk measure is like driving a Mini Cooper. Conversely, employing the historical model is akin to driving a large tour bus. The former provides the ability to swerve more easily, adapting to future risks such as potholes, stop signs, down trees, etc. The latter demands much longer forewarning to be able to safely navigate the danger. Exhibit 1 shows the lethargic rise of the historical beta metric for Amazon, exemplifying the lag needed to identify future risk.
Exhibit 1: Daily Estimation of the Forward Quarter’s Market Risk in 2018
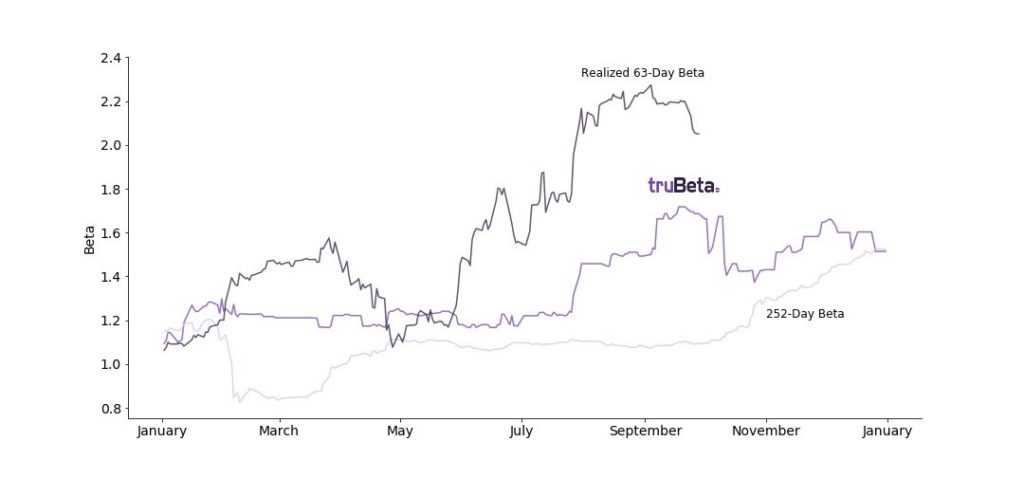
Source: Bloomberg, Salt Calculations. Data from January 2nd, 2018 till December 31st, 2018. Realized 63-Day beta is the realized (actual) risk that is not known at the time of the calculation. Hence there is no value past September 30th, 2018.
Short of knowing the future, we must model these risks from some events in the past. Models can be as simple as assuming a constant value will continue in the future or more complex and dynamic. Both provide a numerical estimate of future risk.
Our proprietary beta measure, truBeta™, provides a potentially more accurate and responsive risk forecast. Unlike other beta estimates, truBeta™ utilizes three different frequencies of data: intraday, daily, and monthly [1]. Using a non-linear model, a process accounting for various scenarios and interactions between variables, our research shows it to be more accurate, thereby delivering more timely, actionable risk estimates. This is done by historically mapping known scenarios to their associated realized risk, and then deciding which is closest to the current day scenario. In contrast to simply using the recent past as an estimate for the future, this allows for more flexibility in the prediction.
For example, suppose Amazon bought a business that was much riskier than the current business. You would expect the risk of the company to increase as well, but this would take time to materialize in conventional risk estimates using historical data. Incorporating intraday returns in the estimate allows more recent events to be better reflected in the forward view of risk. Yet it still retains some of its longer-term trend in volatility and correlation to help mitigate overreactions to shorter term events.
Shareholders of Amazon have felt the magnified sensitivity to overall movements of the SPDR S&P 500 ETF (SPY) over the past quarter. There have been 20 days with a return greater than 4%, in either direction. In fact, only Nvidia and Advanced Micro Devices observed more, at 24 apiece, and they are much smaller companies ($81 Billion and $18 Billion, respectively). However, this much volatility from a mega-cap company, once on the doorstep of a trillion-dollar valuation, is something to note.
The historical model estimated the beta of Amazon to be approximately 1.1 through the first three quarters. In fact, it dropped down to 0.82 in early February only to fight back to 1.1, implying a brief period of less sensitivity to the market (market beta is 1.0). It is doubtful anyone holding shares would have thought its beta was anywhere in the range of 0.82-1.1 after looking at their brokerage account. That’s because the true (Realized 63-Day Beta) market risk for Amazon over the fourth quarter was 2.05, almost double what was suggested by the historical model (1.09), but only 22% higher than truBeta™ (1.69).
.jpg)
Source: Salt Financial. Data from September 30th, 2018.
Perfect accuracy in a model is unattainable, but better is better when it comes to forecasting. truBeta™ pegged Amazon as a higher risk company for the better part of the year, reporting a beta of 1.2 up until the end of July. It didn’t catch the rising risk in June and July, but then again neither did the historical model. It didn’t budge much in February or March either. But this looks far better when compared to the historical model’s falling risk estimate. Finally, it did catch the move higher in August and September while the historical model actually decreased slightly.
Can a risk model tell you which way the stock is going to be trending? No. But a well calibrated model can give you actionable insight into how rocky the ride may be. This knowledge can better inform decisions going forward. Remember, there is no risk in what has already happened. The rearview mirror is worth a quick glance but you should keep your eyes on the road ahead.
[1] This multi frequency model, representing time frames preferred by different investor types, was originally adapted by Corsi [2] to model volatility. The author states this model better captures the main empirical features of financial data (long memory, fat tails, and self-similarity). This mixture allows the model to be more responsive in its estimate, as evidenced by the sharp gyrations in Exhibit 1.
[2] Corsi, Fulvio (2009). A Simple Approximate Long-Memory Model of Realized Volatility. Journal of Financial Econometrics, 7(2), 174-196.
 Prev
Prev

Adaptive Indexing Starts with the Right Partner
Don't miss the next release
Be the first to know when Salt publishes its latest analytics, research, and insights
Disclaimers
The information provided herein is for information purposes only and is not intended to be and does not constitute financial, investment, tax or legal advice. All investments are subject to risks, including the risk of loss of principal. Past performance is not an indicator of future results.
The information and opinions contained in Salt’s blog posts, market commentaries and other writings are of a general nature and are provided solely for the use of Salt. This content is not to be reproduced, copied or made available to others without the expressed written consent of Salt. These materials reflect the opinion of Salt on the date of production and are subject to change at any time without notice. Due to various factors, including changing market conditions or tax laws, the content may no longer be reflective of current opinions or positions.
The information contained herein is not intended as a recommendation to buy, hold or sell any security. The investment performance described herein is simulated and does not reflect actual performance data. Actual investment performance may vary. There is no guarantee that an investment will be profitable and all investments bear the risk of partial or complete loss of capital. Past performance is not an indicator of future results.
Any market observations and data provided are for informational purposes only. Where data is presented that is prepared by third parties, such information will be cited, and these sources have been deemed to be reliable. However, Salt does not warrant the accuracy of this information. Salt and any third parties listed, cited or otherwise identified herein are separate and unaffiliated and are not responsible for each other’s policies, products or services.
Salt Financial LLC
44 Amogerone Crossway, #7910
Greenwich, CT 06830- 475-450-0500
- Contact Us