Betting Big with Beta
Ryan Poirier, ASA, CFA, FRM | Head of Applied Research | ryan@saltfinancial.com
Large market swings can spook even the most experienced traders. Since 2017, the most tranquil calendar year on record, daily moves in excess of 2% have become more common. The S&P 500 declined 2% or more in a day 20 times since the start of 2018, matching the total count for the prior six years combined. The market has not been as kind on the upside, producing only seven days with increases of 2% or more since 2018, and 15 such days over the prior six years.
Many investors fear the big down days but some sophisticated investors harness volatility to their advantage by “buying the dip”. Buying the dip has been an effective strategy since the Global Financial Crisis in 2009 with the past 18 months being no exception. Since the beginning of 2018, buying the S&P 500 on a sell-off in excess of 2% for the day and holding it for three days averaged a 0.42% daily return (35.3% annualized). This compares to the -0.03% average daily return (-7.6% annualized) for all the other days in the period.
Without using leverage or derivatives, a higher beta strategy can be a sharper tool to harvest more of the upside on a short-term reversal, in comparison to the plain old S&P 500. While the Nasdaq 100 or Russell 1000 Growth Index may offer more bang for the buck, an even higher beta alternative has the potential to be even more effective. The Salt High truBeta™ US Market Index was designed to provide more exposure to the market by targeting higher beta stocks using higher frequency data, potentially capturing more of the tactical bounce.
The index launched on February 7, 2018, offering a little over 18 months of historical data since inception to test this 3-day buy-the-dip trade. The S&P 500 fell 2% or more in a day 18 times during this time span, offering sufficient opportunity to test its effectiveness versus alternative benchmarks. The table below displays summary statistics for these 18 three-day buy-the-dip trades using various strategies. For this hypothetical example, the cumulative performance is generated exclusively from these 18 trades as if the portfolio was in cash otherwise, earning no interest. The S&P 500 had a total return of 11.1% over this period.
Exhibit 1: Summary Statistics – Hypothetical 3-Day Index Performance
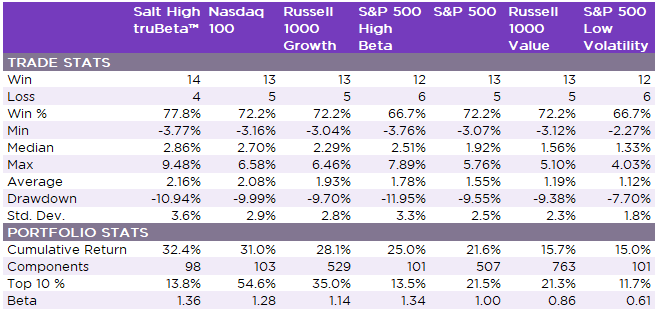
Source: Salt Financial.
The results of this trade have a wide dispersion. Higher beta strategies are an ideal candidate for this type of trading strategy, but not all high beta strategies are created equal.
The S&P 500 High Beta Index left sizable gains on the table, despite having the second highest beta in the group. The cumulative return trailed the Salt High truBeta™ Index by 740 bps, while the drawdown was worse by nearly 100 bps. In fact, the only edge for the S&P High Beta Index was the minimum return (worst trade), eking out a mere 1 basis point in improvement.
The Nasdaq 100 also posted impressive returns in this strategy. However, it is significantly more concentrated in its top 10 names—2.5x the S&P 500 and nearly 4x the concentration of the Salt or S&P high beta indices. Arguably, a more diversified basket with the potential to generate a similar return is preferred, all else being equal.
As expected, Value and Low Volatility are suboptimal styles for this tactical trade, participating in the bounce back but to a lesser extent. They tend to win by losing less over longer periods of time, making them more suitable for buy and hold investing.
This 3-day and out trading strategy holds cash for extended periods, potentially missing stellar market returns such as in 2017, when the market steadily climbed 21.8% on the year. However, investors can implement a modified version of this strategy by holding back a portion of a buy-and-hold portfolio in cash, leaving some dry powder to buy the dips when they occur. We highlight the overall dynamics of the 3-day hold trade here, but the practical application of a smaller high beta sleeve can take many forms.
 Prev
Prev

Adaptive Indexing Starts with the Right Partner
Don't miss the next release
Be the first to know when Salt publishes its latest analytics, research, and insights
Disclaimers
The information provided herein is for information purposes only and is not intended to be and does not constitute financial, investment, tax or legal advice. All investments are subject to risks, including the risk of loss of principal. Past performance is not an indicator of future results.
The information and opinions contained in Salt’s blog posts, market commentaries and other writings are of a general nature and are provided solely for the use of Salt. This content is not to be reproduced, copied or made available to others without the expressed written consent of Salt. These materials reflect the opinion of Salt on the date of production and are subject to change at any time without notice. Due to various factors, including changing market conditions or tax laws, the content may no longer be reflective of current opinions or positions.
The information contained herein is not intended as a recommendation to buy, hold or sell any security. The investment performance described herein is simulated and does not reflect actual performance data. Actual investment performance may vary. There is no guarantee that an investment will be profitable and all investments bear the risk of partial or complete loss of capital. Past performance is not an indicator of future results.
Any market observations and data provided are for informational purposes only. Where data is presented that is prepared by third parties, such information will be cited, and these sources have been deemed to be reliable. However, Salt does not warrant the accuracy of this information. Salt and any third parties listed, cited or otherwise identified herein are separate and unaffiliated and are not responsible for each other’s policies, products or services.
Salt Financial LLC
44 Amogerone Crossway, #7910
Greenwich, CT 06830- 475-450-0500
- Contact Us