A Deeper Look at Liquidity in Smaller ETFs
Tony Barchetto, CFA | Chief Executive Officer | tony@saltfinancial.com
- Average underlying liquidity of the smallest ETFs is generally larger than funds in the middle of the range by asset level – even though spreads are generally wider and volumes lower.
- The spread is a frictional cost that ETFs have that mutual funds do not—but can be offset by the generally lower fees of ETFs.
- A 5-10 bps one-time cost can be a small price to pay to access newer strategies with the potential to outperform.
One of the challenges in bringing new ETFs to market is getting over the initial hurdles posed by the smaller asset levels and lower on-screen liquidity of the fund. If a fund has very little ADV, a large investor can still execute a sizable block in the fund at or often in between the bid-ask spread as long as the underlying basket is liquid. But the smaller investor (or their advisor) often ends up paying the bid-ask spread on the screen, especially if a market order is used. [1]
Despite their ability to transact in size, larger investors are often wary of being the early money in to a newer fund and prefer to see the smaller investors aggregate and build up the assets first. Smaller investors are generally not as concerned by overall fund size but must contend more with spreads and on-screen liquidity.
Given this dynamic, we took a detailed look at the liquidity metrics by size for smaller ETFs. With over 2,200 ETFs listed in the US tracking domestic stocks, international stocks, commodities and a host of other types of assets, we limited the analysis to only funds consisting of US equities. This allows for a more apples to apples comparison in a single category across a range of fund sizes.
We further filtered the list for funds with a minimum of $100 million a day in daily implied liquidity (of the underlying basket), as measured by Bloomberg [2]. This eliminates funds with more concentrated or illiquid portfolios that would not be comparable to your average equity fund. As of March 19, 2019, there were 476 US equity ETFs meeting the criteria.
The table below shows several liquidity indicators aggregated by fund size in $50 million increments at the low end and increasing in ranges at the larger fund levels. This was done to tilt the balance towards the smaller funds to more precisely summarize the relationship between size and liquidity. We also show all funds with over $2.4 billion in assets aggregated in a single group for comparison.
Table 1 – US Equity ETFs Over $100 Million in Daily Implied Liquidity
March 19, 2019
| AUM Range ($mn) | Funds | Median Spread (cents) | Avg Spread (bps) | 30D ADV | Avg 13F Holders | Avg Implied Liquidity ($mn) | Age in Years |
| 0-50 | 116 | 7.2 | 21.3 | 3,661 | 7.7 | $2,060 | 2.6 |
| 50-100 | 40 | 6.3 | 16.0 | 11,028 | 20.6 | $990 | 4.2 |
| 100-150 | 31 | 6.0 | 13.5 | 26,045 | 28.1 | $832 | 5.6 |
| 150-300 | 44 | 7.8 | 15.9 | 30,209 | 36.8 | $1,118 | 7.2 |
| 300-600 | 46 | 4.6 | 7.2 | 74,921 | 65.9 | $1,232 | 8.6 |
| 600-1200 | 58 | 2.9 | 4.3 | 249,212 | 106.6 | $1,763 | 9.8 |
| 1200-2400 | 41 | 2.3 | 3.2 | 705,643 | 169.2 | $2,307 | 11.8 |
| >2400 | 100 | 2.2 | 2.0 | 3,563,795 | 596.6 | $2,782 | 14.4 |
| TOTALS | 476 | 4.8 | 10.5 | 854,184 | 168.9 | $1,893 | 8.1 |
Source: Bloomberg. All are simple, non-weighted averages.
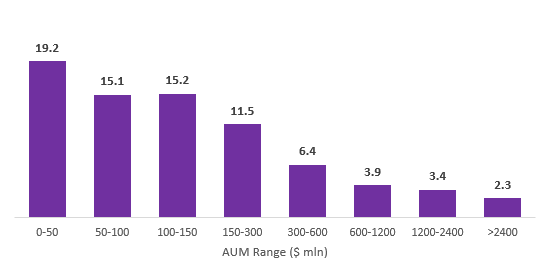
It should not be surprising that as assets increase, spreads tend to decline, ADV increases, and the number of institutional holders (public 13F filers) increase. The average spread for funds in the $50-100 million range drops by 5.3 basis points from smallest segment and then another 2.5 basis points after crossing into the $100-150 million range for a total decline of nearly 37%. But then spread costs increase in the $150-300 million bracket before resuming their decline with higher asset levels but at a slower rate. However, a handful of funds in the $150-300 million bracket with unusually large spreads skewed the data. A look at the median spread in basis points for each segment reduces the impact of these outliers, showing a more consistent decline in spread cost with asset level.
Figure 1 – Median Spread by AUM Range (in basis points)
March 19,2019 – US Equity ETFs with Over $100 million in Implied Liquidity
Source: Bloomberg
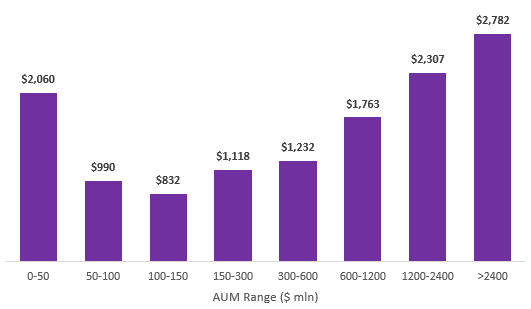
However, the implied liquidity tells a different story. There does appear to be a relationship between the implied liquidity and both spreads and traded liquidity (ADV) as AUM increases. But this may just reflect more of the “natural” capacity for some funds. Funds with smaller capitalization stocks or narrowly-defined portfolios (i.e. thematic funds) may reach a point in which some larger investors cannot easily transact due to limitations in the underlying liquidity, keeping a lid on fund assets even as the funds mature (note the increasing age in funds in Table 1 with asset level).
The smallest bucket is unique in this regard. The average implied liquidity in the $0-50 million bracket is over $2 billion—much higher than most of the middle AUM range. This suggests many smaller funds do have very liquid underlying baskets but just have low levels of daily trading activity in the funds.
Figure 2 – Average Daily Implied Liquidity by AUM Range (in $ millions)
March 19,2019 – US Equity ETFs Over $100 million in Daily Implied Liquidity
Source: Bloomberg
The frictional costs—namely spreads and commissions—are one of the few drawbacks of ETFs versus their many benefits in comparison to mutual funds. But putting it in perspective, many investors use ETFs for buy and hold investing, making entry and exit costs relatively infrequent compared to the annual savings enjoyed from generally lower fees on ETFs.
In addition, while the full quoted spreads are summarized above, a more accurate assessment of cost would be the difference between the bid or offer and the fair value for the underlying portfolio (estimated by the INAV)—not the entire spread. The fair value for the portfolio will typically be in between the spread with the bid and offer falling just outside. This means the true cost is generally about half the quoted spread, pushing the 10-20 bps spread in equity ETFs under $300 million down to an effective cost of about 5-10 bps.
Considering any investment involves weighing the merits of the strategy along with the total costs—implementation, expense ratio, taxes, etc. Transaction costs such as commissions and spreads are real expenses that should be weighed along with the other factors. But if the underlying securities in the fund are generally liquid and the expense ratio is attractive, a one-time 5-10 bps cost to access a differentiated strategy with the potential to outperform is a small price to pay. If enough investors make that leap, the data suggest that 5-10 bps spread will begin to shrink with even a modest boost in assets.
[1] We believe using a limit order is generally a best practice for any ETF order. Most retail investors orders in the US are executed off-exchange by competing market makers that must provide some price improvement to continue attracting order flow. A well-placed limit order in an ETF has the potential to be executed at prices better than the bid or offer. The firms competing for retail order flow are also among the largest participants in the ETF market executing blocks for large investors.
[2] Bloomberg’s Implied Liquidity metric estimates the share and dollar amount that could potentially be traded in an ETF in one day based on the liquidity available in the underlying basket. By default, it assumes that 25% of the ADV of each component could be traded without adversely affecting the price and then uses the weights to calculate the least liquid component and scales the basket using this constraint.
The information provided herein is for information purposes only and is not intended to be and does not constitute financial, investment, tax or legal advice. All investments are subject to risks, including the risk of loss of principal. Past performance is not an indicator of future results.
The information and opinions contained in Salt’s blog posts, market commentaries and other writings are of a general nature and are provided solely for the use of Salt. This content is not to be reproduced, copied or made available to others without the expressed written consent of Salt. These materials reflect the opinion of Salt on the date of production and are subject to change at any time without notice. Due to various factors, including changing market conditions or tax laws, the content may no longer be reflective of current opinions or positions.
The information contained herein is not intended as a recommendation to buy, hold or sell any security. The investment performance described herein is simulated and does not reflect actual performance data. Actual investment performance may vary. There is no guarantee that an investment will be profitable and all investments bear the risk of partial or complete loss of capital. Past performance is not an indicator of future results.
Any market observations and data provided are for informational purposes only. Where data is presented that is prepared by third parties, such information will be cited, and these sources have been deemed to be reliable. However, Salt does not warrant the accuracy of this information. Salt and any third parties listed, cited or otherwise identified herein are separate and unaffiliated and are not responsible for each other’s policies, products or services.