Red or Blue…Investors See Green?
Ryan Poirier, ASA, CFA, FRM | Head of Applied Research | ryan@saltfinancial.com
With the election now history, investors can focus on the rest of the year with one less uncertainty. But what can they expect from the market going into the new year? Historical returns of the S&P 500 following a midterm election are significantly higher in comparison to presidential election or off years. Post midterm markets rallied by an average 15% in the year after the polls close followed by presidential election years at 9%, and then off years at only 6.9% (the average for all years was 9.4%).
The first eight months after midterms are particularly strong. Average returns for this period are 17.1%, compared to a 7% return for years in which a president is elected, and 4.1% for all off years. However, the post midterm bump tends to experience a sharp reversal going into the summer. While presidential and off years maintained strength at 1.9% and 2.6%, respectively, midterm years had a negative 1.7% return, on average over the final four months. The start of the summer is when investors should consider reevaluating their equity exposure for the next four months, potentially rebalancing if necessary to lock in gains.
Exhibit 1: Average Historical Performance Following Election Cycles
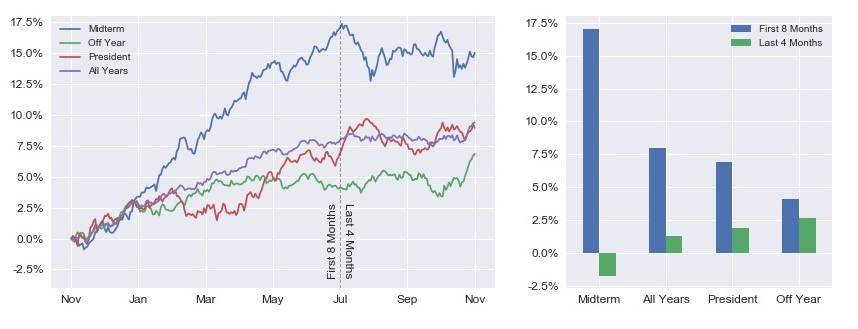
Source: Bloomberg, Salt Calculations.
Regardless of an election cycle, the market historically tends to show strong performance from November through December. In fact, December has been the most consistent month of the calendar year, delivering positive returns 75% of the time. The next closest months are April and November at 69% apiece. However, this number does not tell the whole story. For example, December has the second lowest standard deviation of returns. April and November rank 5th and 9th, respectively, implying less certainty in expected returns.
January has historically been in the middle of the pack, producing a positive return 59% of the time. However, January following a midterm has given a positive start to the new year 10 out of 12 (losses of 2.7% and 3.1%) times since 1970, making it the strongest month. If fact, post midterm Januarys have the largest median return (3.6%) of any other month, including those in presidential and off years. Moreover, the months of February, March, and April following a midterm rank 4th, 5th, and 2nd among all months, respectively.
October 2018 was a particularly bad month for the market, recording 16 down days and ending the month with a 6.84% deficit. Perhaps it was de-risking until the election was over or simply discovering a new price level with all available information. Regardless, history suggests the next eight months should be clear sailing followed by stormy waters around summer time, ironically. The market started the charge on the right foot on Wednesday, recording a 2.1% gain, the largest one-day post midterm rally since 1982.
The information provided herein is for information purposes only and is not intended to be and does not constitute financial, investment, tax or legal advice. All investments are subject to risks, including the risk of loss of principal. Past performance is not an indicator of future results.
The information and opinions contained in Salt’s blog posts, market commentaries and other writings are of a general nature and are provided solely for the use of Salt. This content is not to be reproduced, copied or made available to others without the expressed written consent of Salt. These materials reflect the opinion of Salt on the date of production and are subject to change at any time without notice. Due to various factors, including changing market conditions or tax laws, the content may no longer be reflective of current opinions or positions.
The information contained herein is not intended as a recommendation to buy, hold or sell any security. The investment performance described herein is simulated and does not reflect actual performance data. Actual investment performance may vary. There is no guarantee that an investment will be profitable and all investments bear the risk of partial or complete loss of capital. Past performance is not an indicator of future results.
Any market observations and data provided are for informational purposes only. Where data is presented that is prepared by third parties, such information will be cited, and these sources have been deemed to be reliable. However, Salt does not warrant the accuracy of this information. Salt and any third parties listed, cited or otherwise identified herein are separate and unaffiliated and are not responsible for each other’s policies, products or services.