Hedging Your Bets: Another Way to Play Defense
Tony Barchetto, CFA | Chief Executive Officer | tony@saltfinancial.com
While the latest action from Robintrack, r/wallstreetbets, and DDTG garners all the headlines, many investors and their advisors are still looking for better ways to protect their downside while staying invested in stocks for the long term. Just last Thursday, we were reminded how nasty the downside can be with the S&P 500 selling off over 5% on the day after a sustained rally from the March lows.
Regardless of whether we slide further down or rally to new highs, we’re pleased to be introducing a new strategy, the Salt truVol™ US Large Cap Dynamic Hedge Index (index ticker: SFTDH), that aims to reduce risk by dynamically hedging an S&P 500® portfolio with S&P 500® futures.[1] The strategy uses the historical negative relationship between returns and market volatility to scale the hedge, attempting to smooth out returns over the full market cycle. SFTDH uses Salt’s truVol™, a proprietary forecast of market volatility designed to react faster by using higher frequency, intraday data instead of just daily closing prices used by traditional volatility measures.
The index adjusts its hedge ratio potentially daily. As market volatility rises, the truVol™ forecast will tend to rise and the percentage of the portfolio hedged with S&P futures increases, and vice versa. While the hedge ratio can range from 0% to 100%, its average historically (9/9/1997 – 6/12/2020) is 46.2% hedged.[2]
Dynamic hedging is not a new concept and is currently used in a range of strategies to help reduce risk, often lumped together as “volatility targeting” funds. Risk parity strategies attempt to weight assets by risk, sometimes deploying leverage to increase exposure to lower volatility assets and de-levering others with cash. Others seek to buy or sell risky assets to target a desired level of portfolio volatility, adjusting exposure as conditions change. The total size of funds pursuing these strategies was recently estimated at over $400 billion.[3]
Volatility targeting is often blamed for exacerbating market declines, from the infamous “Volmageddon” in February 2018 to being another key contributor to the mayhem this March following the COVID-19 outbreak. But this wrongly assumes that volatility targeting is a monolith, reacting to the same exact signals over the same timeframes. A return-based analysis of just risk parity funds showed very disparate returns among a group of strategies that are supposedly doing the same thing, using recent data through April 2020.[4]
Investors only pursue volatility targeting strategies for one reason: they believe they can help improve risk-adjusted performance in their portfolios. In our Research Note, “Risk Before Return: Targeting Volatility with Higher Frequency Data”, we demonstrate the basics of volatility targeting using a simple hypothetical portfolio that allocates between cash and the S&P 500, comparing several different methods of estimating volatility.
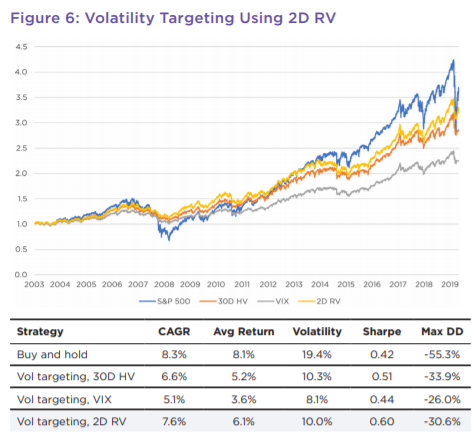
Source: Salt Financial, Risk Before Return: Targeting Volatility with Higher Frequency Data (June 2020)
Reducing exposure during period of high volatility has the potential to smooth out returns over time and generate higher Sharpe ratios than a basic buy and hold strategy. From risk parity to targeting to dynamic hedging, using volatility levels to actively right-size risk can be a powerful tool for investors to seek returns over the long term.
Sometimes the best way to avoid getting punched in the face is not to be in the ring. Hedge your bets.
[1] The Salt truVol™ US Large Dynamic Hedge Index was incepted on March 30, 2020 and is calculated by S&P Dow Jones Indices, LLC. Historical values prior to the inception date represent back-tested, hypothetical performance using the same methodology implemented retroactively with the benefit of hindsight. Past performance is no guarantee of future results. You cannot invest directly in an index.
[2] The hedge ratio for the index as of 6/12/2020 and effective for 6/15/2020 was 100%.
[3] https://www.wsj.com/articles/volatility-could-cause-more-pain-as-funds-betting-on-quiet-sell-down-stocks-11557658823
[4] The original study was conducted by Markov Processes International, available here. The analysis only covered publicly traded risk parity funds and did not include any private funds or other forms of volatility targeting that may use different strategies. The range of max drawdowns among the risk parity funds was -13.4% to -42.8%, with an average of -22.2% from December 31, 2019 through April 9. Year to date returns ranged from -0.1% to -18.8% (following the recovery from the March lows).
The information provided herein is for information purposes only and is not intended to be and does not constitute financial, investment, tax or legal advice. All investments are subject to risks, including the risk of loss of principal. Past performance is not an indicator of future results.
The information and opinions contained in Salt’s blog posts, market commentaries and other writings are of a general nature and are provided solely for the use of Salt. This content is not to be reproduced, copied or made available to others without the expressed written consent of Salt. These materials reflect the opinion of Salt on the date of production and are subject to change at any time without notice. Due to various factors, including changing market conditions or tax laws, the content may no longer be reflective of current opinions or positions.
The information contained herein is not intended as a recommendation to buy, hold or sell any security. The investment performance described herein is simulated and does not reflect actual performance data. Actual investment performance may vary. There is no guarantee that an investment will be profitable and all investments bear the risk of partial or complete loss of capital. Past performance is not an indicator of future results.
Any market observations and data provided are for informational purposes only. Where data is presented that is prepared by third parties, such information will be cited, and these sources have been deemed to be reliable. However, Salt does not warrant the accuracy of this information. Salt and any third parties listed, cited or otherwise identified herein are separate and unaffiliated and are not responsible for each other’s policies, products or services.