The Curse of Being Correct: Volatility
Ryan Poirier, ASA, CFA, FRM | Director, Index and Product Research | ryan@saltfinancial.com
- Daily reset leveraged ETFs are generally only suitable for short-term trading, not longer-term investing.
- Although they do not target a multiple for periods longer than one day, investors are often confused and expect similar results over longer periods.
- A simulated investment in the S&P 500 with 3x daily reset leverage with a one-quarter holding period underperformed the S&P 500 multiplied by three nearly 90% of the time.
- Only 11% of quarterly periods ended with a 3x daily leveraged portfolio outperforming the return of the S&P 500 return multiplied by three.
- 6% of the time, the simulated investment moved in the opposite direction of the index because of negative compounding.
Investing is inherently difficult. The investment process, consisting of strategy ideation, economic research, company screens, etc. can takes days if not months to cultivate information that can (potentially) lead to a profitable investment. Once implemented, and if correct in both timing and direction, the reward may take years to materialize. As Warren Buffett once stated, “Our favorite holding period is forever”.
One way to increase the degree of difficulty in the investment process is to use tools that may not be suitable for the job or are simply misunderstood. For example, leveraged ETFs, products that use a derivative or borrowing to gain additional market exposure, are often misunderstood regarding the underlying mechanics and can lead to confusion for investors. These products do an excellent job of providing magnified exposure for a period of one day, but are often held by retail investors for longer than one day with the expectation of experiencing leveraged gains over an arbitrarily long period. For example, suppose the S&P 500 has a return of 2% during the first day and -2% on the second day. A perfectly leveraged 3x product will return 6% (2% * 3x) during the first day and -6% during the second. Thus, with a one day holding period, the result is exactly 3x the S&P 500 (e.g. 2% and 6% or -2% and -6%). Conversely, with a holding period of two days the returns are as follows:
S&P 500 =(1+0.02)∗(1−0.02)−1=−0.04%
S&P 5003x =(1+0.06)∗(1−0.06)−1=−0.36%
This is the effect of negative compounding. That is, the leveraged return is 9x the return of the S&P when you may have expected a return of -0.12% (-0.04% * 3x) over the two-day period.
While no sophisticated manager (or advisor) would propose this strategy because of this well-known negative compounding, we present it nonetheless for educational purposes targeted at the retail market segment, which may not have full information otherwise. We examined the experience of an investment over one quarter (63 trading days) from January 4th, 1988 to June 30th, 2018 by splitting the entire period into 7627 unique periods each separated by one day (i.e. a rolling window analysis).
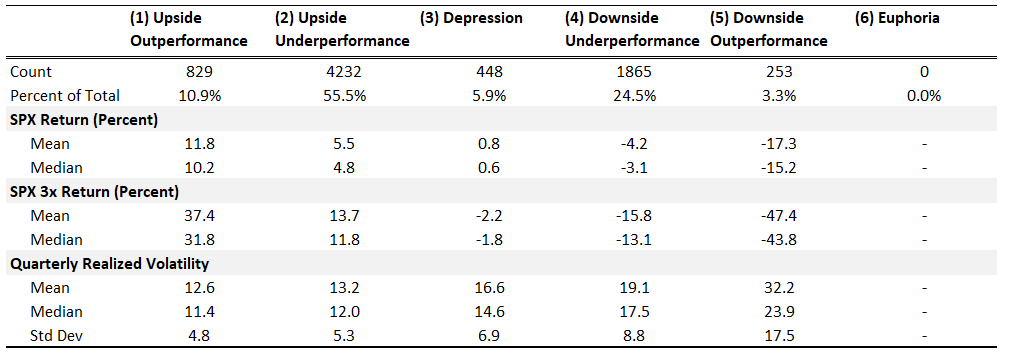
Exhibit 1 shows the scatterplot of quarterly returns for an unleveraged investment in the S&P 500 versus a hypothetical portfolio of 3x daily leverage in the S&P 500 [1]. The color of the data point represents the annualized volatility during the quarter, with darker purple corresponding to higher volatility. The diagonal line represents three times the return of the S&P 500, which when combined with both axes creates six unique regions for which we can analyze separately. Traversing the regions clockwise, we observe increasing volatility, as measured by the median and mean (see table below). Similarly, an increasing relationship exists in the standard deviation (variability or dispersion) of the realized volatilities. While a given volatility level does not determine the location of a datapoint, it does appear that there are unique distributions within each region (based on the mean and standard deviation, as well as the color distribution).
Exhibit 1: Rolling Quarterly S&P 500 Return versus Quarterly Return of an 3x Daily Reset Leveraged S&P 500 Strategy
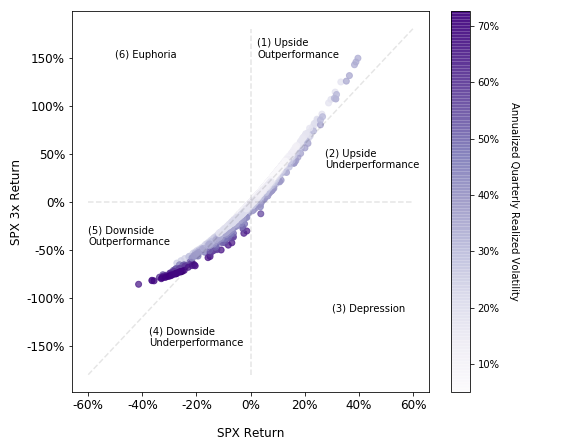
Source: Bloomberg, Salt Calculations. Returns are gross of fees. The SPX 3x hypothetical portfolio is modeled such that the portfolio borrows cash at a 1-Month LIBOR rate to achieve the necessary leverage. Data from 1/4/1988 to 6/30/2018.
What Does This Mean For Investors?
Through the entire simulation, only 10.9% of all unique quarterly periods experienced an optimal outcome of realizing 3x or more relative to the S&P 500 return. Furthermore, over two-thirds (70.2%) of these periods were in the last decade, undoubtably one of the strongest bull markets. Approximately 86% of the time, the 3x leveraged return ended the quarter below the diagonal, underperforming expectations in up and down markets.
Exhibit 2 displays a magnified portion of Exhibit 1 to illustrate these outcomes. The red area represents an outcome in which ‘confusion’ may set in for investors (e.g. why is the S&P 500 down -5% and my portfolio is down more than -15%?). Region (3) is such that the S&P moved positive, resulting in the correct directional prediction, but the investment in a 3x strategy is negative. This is the result of a highly volatile quarter coupled with the S&P 500 failing to move upward enough to compensate for the negative compounding. For example, the S&P 500 oscillates between +2% and -1.96% for the first 62 days, resulting in a 0% gain, and then ends the quarter with a daily return of 2%. This results in the following hypothetical returns:
This is essentially what happened during the period from October 27th, 2008 to January 28th, 2009. In conclusion, when holding this type of product for one quarter you must decide whether you are willing to be correct in direction and end up losing money 6% of the time; those odds appear quite poor.
Region (4) illustrates an investor’s aversion to losing more than the prescribed leverage when the S&P is negative. We assume investors will be indifferent with at least a 2x multiple of upside return, so region (2) cuts off at 2x the return of the S&P 500, leaving the rest of the area under the diagonal line as green. The rationale being that you may be indifferent if the market returned 10%, while you only captured 26% (less than 3x) because your portfolio is up enough not to inquire about the additional 4%. Conversely, you may be confused as to why the S&P moved positive 10% and your portfolio is only positive 18%, leading to questions about the attribution of the other 12%.
Exhibit 2: Amplification of Exhibit 1 Around The Origin (0%, 0%)
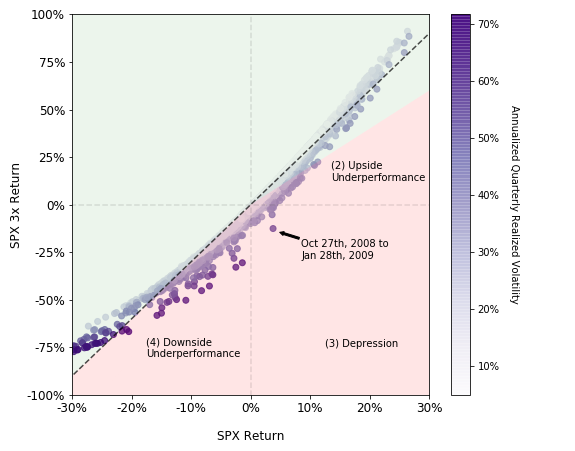
Source: Bloomberg, Salt Calculations. Returns are gross of fees. The SPX 3x hypothetical portfolio is modeled such that the portfolio borrows cash at a 1-Month LIBOR rate to achieve the necessary leverage. Data from 1/4/1988 to 6/30/2018.
Given that investing is already complicated, there is minimal room for additional complexities in the tools used within portfolio construction. For those that are not aware of the effects of negative compounding and have a longer holding period, a leveraged product can be a poor tool to use. Einstein once said, “Everything should be made as simple as possible, but no simpler”. Even with conservative assumptions, our simulation suggests that the result from holding a daily reset leveraged portfolio for a quarter led to potential confusion or disappointment a little less than half the time; one can argue that a leveraged product is anything but simple.
[1] The hypothetical portfolio of 3x daily leverage in the S&P 500 is calculated as follows:
Levelt=Levelt−1∗[1+K∗S&P 500tS&P 500t−1−(K−1)∗(Rate360)∗ Days]Where:
Levelt=Index value at time t
S&P 500t=S&P 500 total return index value at time t
K=Leverage factor=3
Rate=Underlying borrowing rate=1−Month treasury Bill
Days=Number of days between t and t−1
The information provided herein is for information purposes only and is not intended to be and does not constitute financial, investment, tax or legal advice. All investments are subject to risks, including the risk of loss of principal. Past performance is not an indicator of future results.
The information and opinions contained in Salt’s blog posts, market commentaries and other writings are of a general nature and are provided solely for the use of Salt. This content is not to be reproduced, copied or made available to others without the expressed written consent of Salt. These materials reflect the opinion of Salt on the date of production and are subject to change at any time without notice. Due to various factors, including changing market conditions or tax laws, the content may no longer be reflective of current opinions or positions.
The information contained herein is not intended as a recommendation to buy, hold or sell any security. The investment performance described herein is simulated and does not reflect actual performance data. Actual investment performance may vary. There is no guarantee that an investment will be profitable and all investments bear the risk of partial or complete loss of capital. Past performance is not an indicator of future results.
Any market observations and data provided are for informational purposes only. Where data is presented that is prepared by third parties, such information will be cited, and these sources have been deemed to be reliable. However, Salt does not warrant the accuracy of this information. Salt and any third parties listed, cited or otherwise identified herein are separate and unaffiliated and are not responsible for each other’s policies, products or services.