Quarterly Review: Spotlight on Sector Concentration
Tony Barchetto, CFA | Chief Executive Officer | tony@saltfinancial.com
Style and factor indices tend to have a higher concentration in a few sectors in comparison to broader market indices.
The Salt High truBeta™ US Market Index is designed to provide magnified exposure to the US market by selecting stocks with a high sensitivity to market moves. Since inception on February 7th, 2018, the total return version of the index (SFMGXT) returned 7.11% compared to 4.46% for the S&P 500 through June 15th, 2018.
The index rebalanced on March 16th and again this past Friday (June 15th) according to its regular quarterly schedule. The table below shows the returns, annualized volatility, and the top three sector weights at the end of this period for the Salt High truBeta™ US Market Index, the S&P 500, and a selection of large cap style/factor indices from S&P.
Selected Index Performance – Total Returns (3/16/2018 – 6/15/2018)
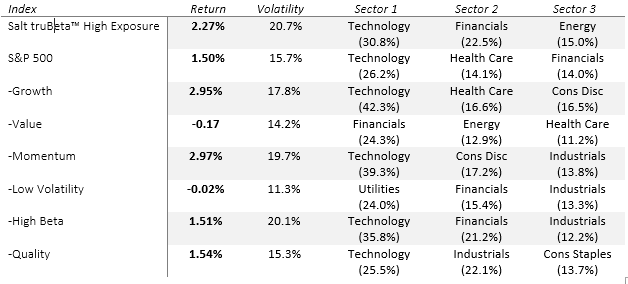
Source: Bloomberg
Highlights
- Growth continued to outperform value. S&P Value and Low Volatility posted small losses for the period whereas higher volatility styles like Momentum, Growth, and Salt’s High Exposure Index posted gains.
- The energy sector was the stealth performer. Although technology has been strong all year, it was energy that was the standout over the period, returning 10.9% followed by consumer discretionary at 6.9% and technology at 3.4% (all returns from the corresponding SPDR Select ETFs-XLE, XLY, and XLK via Bloomberg).
- Financials brought up the rear. The Italian debt crisis weighed on the financial sector with a 4.4% decline (as per the SPDR Select Financials ETF—XLF via Bloomberg). However, the banks and insurance companies fared worse than the brokers and regional banks. The KBW Bank and KBW Insurance indices each fell 4.2% whereas the NYSE Arca Securities Broker/Dealer Index dropped 1.5% and the KBW Regional Bank Index managed a gain of 0.61%. Exposure to sectors moving in and out of favor from quarter to quarter can obviously dramatically affect performance. One of the unique characteristics of the Salt High truBeta™ US Market Index is its responsiveness to sector rotations, as it primarily uses data from the last two months to estimate how stocks move with the overall market (click here for additional information on how truBeta™ is calculated).
Compared to the other indices with similar volatility levels (Growth, Momentum, and High Beta), truBeta™ was the only one to include energy among its top 3 sectors. Given the index methodology, the energy sector was estimated to be more sensitive to market moves as of the rebalancing date on March 16th. The overweighting in energy was a positive contribution to performance over the period, partially offset by a negative contribution by weaker financials. As of the June 15th rebalance, the index is over-weighted in technology (34.8%), financials (25.6%), and industrials (18.9%), reflecting the changes in truBeta™ scores over the quarter, with energy names dropping off entirely.
Sector over- and under-weighting introduces some tracking error to a broad-based benchmark such as the S&P 500. However, style indices like the ones highlighted above consistently deviate from the market weights to create differentiated exposure from the market portfolio. For example, growth indices tend to be focused on more cyclical sectors such as technology, consumer discretionary, and industrials whereas value tends to concentrate in financials, health care, and consumer staples.
Adding styles or factors with different sector weightings can reduce risk in a portfolio if they lead to more diversification (generally less correlation among the strategies). But they can also increase risk if they lead to higher levels of sector concentration that may be susceptible to external shocks (i.e. changes in regulation, commodity prices, cracks in the credit markets). It is important to look inside the strategies that make up a portfolio to understand the potential risks as well as the opportunities in tilting exposure towards specific sectors, especially when the sector tilt is more a by-product of style selection and not the primary objective in portfolio construction.
The information provided herein is for information purposes only and is not intended to be and does not constitute financial, investment, tax or legal advice. All investments are subject to risks, including the risk of loss of principal. Past performance is not an indicator of future results.
The information and opinions contained in Salt’s blog posts, market commentaries and other writings are of a general nature and are provided solely for the use of Salt. This content is not to be reproduced, copied or made available to others without the expressed written consent of Salt. These materials reflect the opinion of Salt on the date of production and are subject to change at any time without notice. Due to various factors, including changing market conditions or tax laws, the content may no longer be reflective of current opinions or positions.
The information contained herein is not intended as a recommendation to buy, hold or sell any security. The investment performance described herein is simulated and does not reflect actual performance data. Actual investment performance may vary. There is no guarantee that an investment will be profitable and all investments bear the risk of partial or complete loss of capital. Past performance is not an indicator of future results.
Any market observations and data provided are for informational purposes only. Where data is presented that is prepared by third parties, such information will be cited, and these sources have been deemed to be reliable. However, Salt does not warrant the accuracy of this information. Salt and any third parties listed, cited or otherwise identified herein are separate and unaffiliated and are not responsible for each other’s policies, products or services.