We're in No Man's Land—Rookies and Vets Both Struggle to Find Meaning
Tony Barchetto, CFA | Chief Executive Officer | tony@saltfinancial.com
There’s nothing marking the transition from young punk to grizzled veteran in the markets. It just happens. One day you’re trying not to botch the lunch order while scrambling to find a “box of upticks”. [1] The next you’re looking back at a dozen or so past train wrecks in the market with a lot more grey hair on your head.
Asian Contagion (1997). LTCM and Russia sovereign debt default (1998). Dot-com (2000). September 11th (2001). Enron and Worldcom (2002). Global Financial Crisis (2008). European debt crisis and the Flash Crash (2010). Downgrade of US sovereign debt (2011). Chinese market crash (2015-2016). Whatever they are calling that Christmas Eve meltdown in 2018. And now COVID-19.
I’ve spent most of the last quarter century watching the market from the field, from box seats along the first base line, and sometimes in left field working the scoreboard, but I don’t have the foggiest on what to make of the current situation.
The only thing we know for sure is the speed of the decline, which is unprecedented. It took just 19 days to slide from all-time highs on February 19th to the traditional but arbitrary 20% pullback that signals a bear market, compared to a historical average of 136 days. [2]
For those too young to remember, it’s only natural to ask, “Is this what 2008 felt like?” The answer is yes, it does. But it’s different. They all are. While 2008 was devastating, it was (for most) not a matter of life or death.
The eerie, empty streets, canceled flights, and hunkering down at home are somewhat reminiscent of the post-9/11 period, but again, it’s not the same. As much as we like to see patterns in everything, this is its own beast. And we are flying blind.
At this point, surveying the damage from high above seems like the most sensible place to start. What the hell just happened? What is bombed out and what was barely touched? What was expected and what are the surprises?
Below is a just a simple accounting of percentage changes for global equities, fixed income/currencies/commodities (FICC), US sectors, and US industries from the February 19th high through to the 12.9% gut-punch to the Dow Jones Industrial Average on March 16th.[3]
Equities
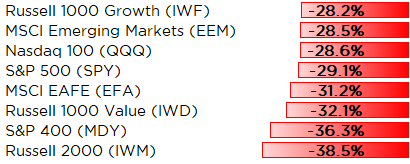
Stocks globally were badly battered but poor value and small cap investors just can’t catch a break. Would you have guessed emerging markets outperformed the S&P 500? Me neither.
Fixed Income, Currency, Commodities
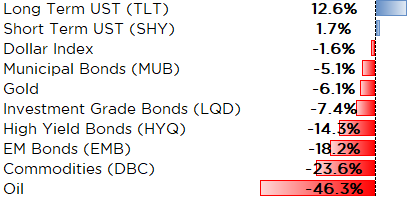
Not surprisingly, long term Treasuries were the only port in the storm—unless you were long volatility (not shown as it would blow up the scale on the chart). The VIX index shot up from 14.38 to 82.69, powering returns for investors in volatility derivatives and ETFs. So far, gold has failed in its traditional role as a haven, despite massive cuts in short-term interest rates by the Fed.[4]
US Sectors
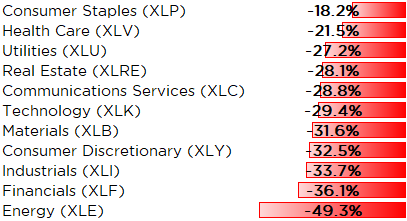
Relative sector performance reveals few surprises. All those rolls of toilet paper must be paying off with Consumer Staples leading the pack, at least relatively. And despite Technology driving the market to its lofty heights, it did not pay the price on the way down—Energy and Financials are the biggest losers so far.
US Industries
Peeling back the onion at individual industries and companies starts to get more interesting. Using Bloomberg industry classifications on the approximately 1600 stocks in the Vanguard Total Stock Market ETF as a broad market proxy, not a single industry group escaped unscathed. Only 35 of the 1636 stocks on the list managed to notch a positive return since February 19th.
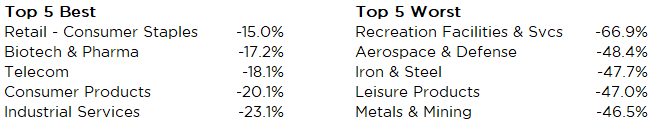
The relative winners included expected names like BJ’s Wholesale (BJ) and Costco (COST) and biotechs with potential coronavirus-related test kits and therapeutics like Co-Diagnostics (CODX). In Consumer Products, bleach maker Clorox (CLX) is actually up 6% with a handful other household goods and foodstuffs like Campbell Soup (CPB) managing to eke out a gain.
Among the losers, “Recreation Facilities & Services” is a tiny group consisting of basically movie theaters (AMC CNK), pole-axed for obvious reasons. Boeing and its various suppliers in Aerospace & Defense dropped almost half their value with airliners likely to slash their capital spending. And economically sensitive basic materials producers managed to outpace Oil & Gas on the downside.
When you start drilling down, the carnage looks worse than it does from the top. A 30% market drop in less than a month is nothing to sneeze at. But the violence in this move has taken 60-80% chunks out of some companies that looked just fine a few weeks ago.
I don’t have a playbook because I don’t think there is one. My objective was simply to survey the damage—fly over the flood zone and see what we’re dealing with. There will be opportunities for investors to pick up stocks at very attractive prices, but patience and a strong stomach will likely be prerequisites for success. Unlike natural disasters that tend to blow through quickly and leave us time to clean up and rebuild after, the market can unleash its fury repeatedly.
It’s a tough slog for rookies and veterans alike. In the meantime, I’m going to search for that box of upticks.
[1] Sending a rookie to various corners of the office searching for that elusive box of upticks is among the tamest of trading desk hazing rituals.
[2] Dow Jones Market Data
[3] All data from Bloomberg as of March 16, 2020.
[4] If you want to include Bitcoin in this group, be my guest. It’s down 49%.
The information provided herein is for information purposes only and is not intended to be and does not constitute financial, investment, tax or legal advice. All investments are subject to risks, including the risk of loss of principal. Past performance is not an indicator of future results.
The information and opinions contained in Salt’s blog posts, market commentaries and other writings are of a general nature and are provided solely for the use of Salt. This content is not to be reproduced, copied or made available to others without the expressed written consent of Salt. These materials reflect the opinion of Salt on the date of production and are subject to change at any time without notice. Due to various factors, including changing market conditions or tax laws, the content may no longer be reflective of current opinions or positions.
The information contained herein is not intended as a recommendation to buy, hold or sell any security. The investment performance described herein is simulated and does not reflect actual performance data. Actual investment performance may vary. There is no guarantee that an investment will be profitable and all investments bear the risk of partial or complete loss of capital. Past performance is not an indicator of future results.
Any market observations and data provided are for informational purposes only. Where data is presented that is prepared by third parties, such information will be cited, and these sources have been deemed to be reliable. However, Salt does not warrant the accuracy of this information. Salt and any third parties listed, cited or otherwise identified herein are separate and unaffiliated and are not responsible for each other’s policies, products or services.